
Help Center / Analytics
Analytics
Analytics turns your closed trades into an honest performance review: a written verdict from MeruIQ, an equity curve with drawdown, distribution and timing charts, a discipline scorecard, guardrail checks against your playbooks, and breakdowns by symbol, setup, and more. Everything on the page recomputes instantly when you change the time range.
Choosing what the page analyzes
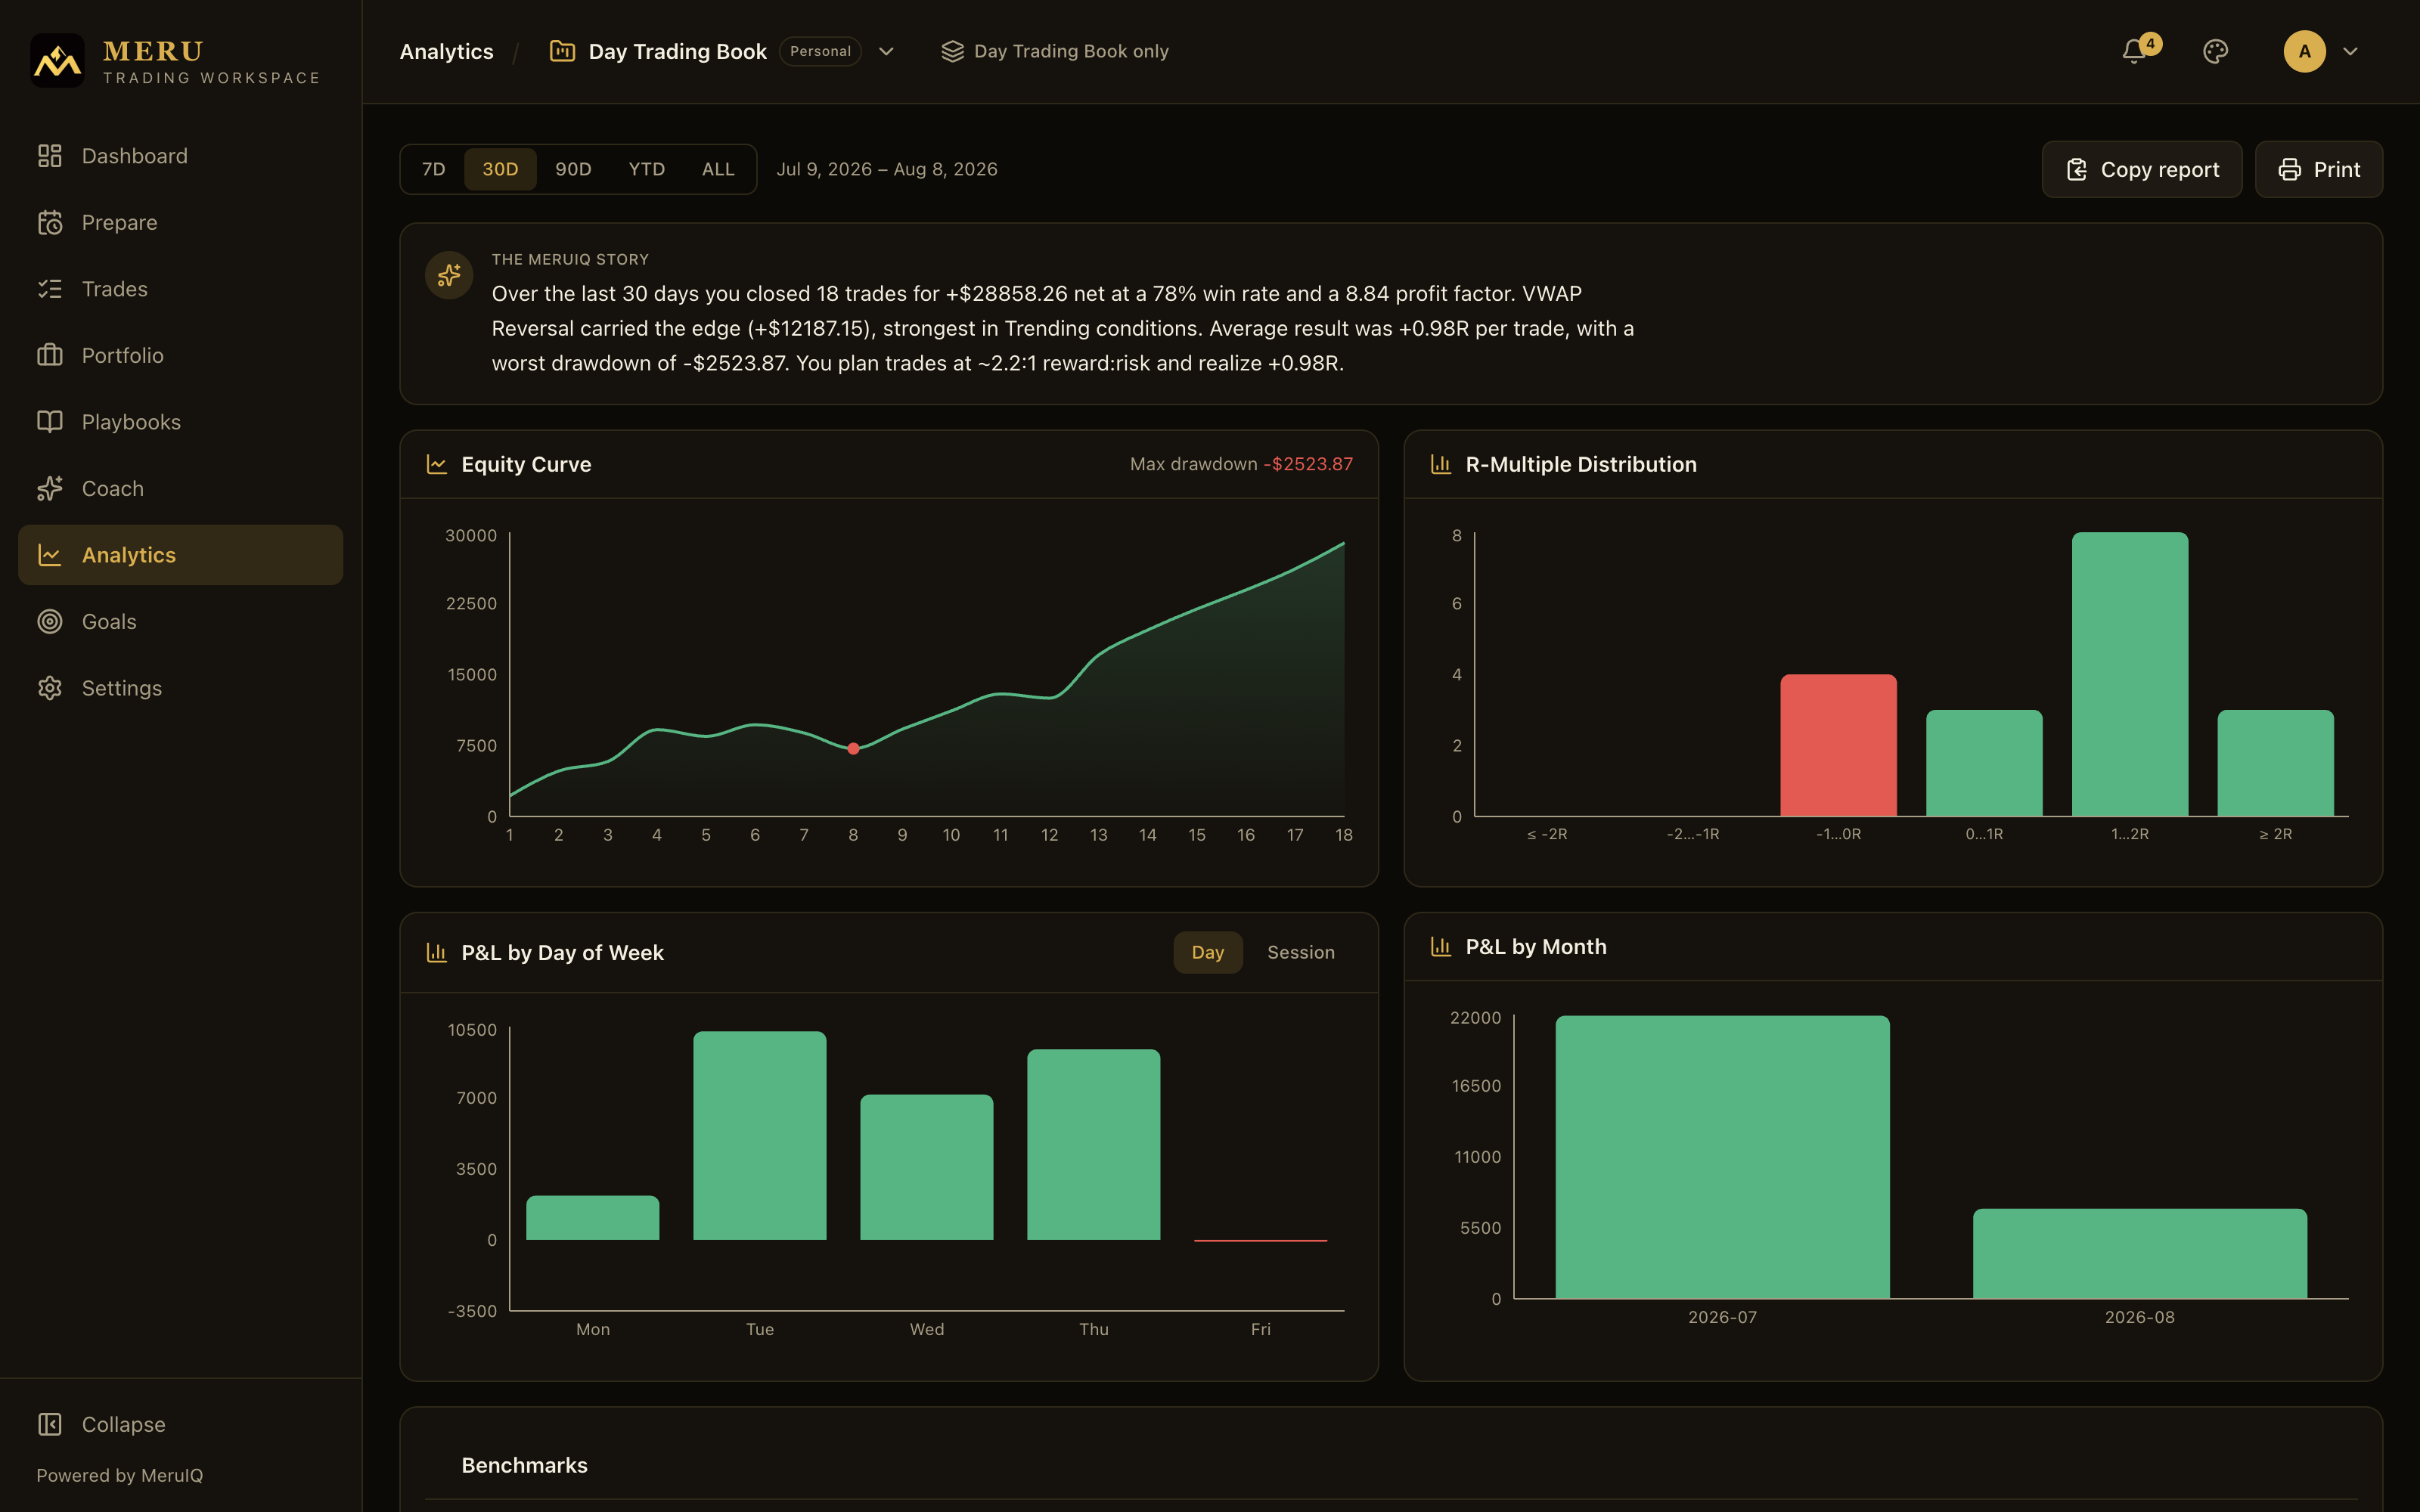
- Pick a time range at the top left: 7D, 30D, 90D, YTD (this year), or ALL (your full history). The default is 30D. The exact date range being analyzed is printed next to the buttons.
- Every number and chart on the page covers the closed trades whose close date falls inside that range. Open positions are excluded from the statistics; they only appear as the "open now" count.
- The page follows the workspace scope in the app header. Switch workspaces, or turn on the header's All workspaces view, and the analytics follow. When you're viewing a book someone shared with you, the page analyzes that book, never your own trading.
Every figure on the page is computed once, on the server, from the same closed trades, so the numbers you see here match the dashboard, the mobile app, and the copied report to the cent. A partial exit counts as its own closed trade (see Scaling out). When a corporate action falls inside the period, a notice under the story, Prices are as traded, not adjusted, lists the actions (for example NVDA 10-for-1 split, ex Jun 10, 2024) so you know why entries and exits on those positions are not directly comparable.
The MeruIQ Story
The card at the top is a written verdict built from your numbers for the selected range. It always opens with the headline: how many trades you closed, the net P&L, your win rate, and your profit factor. Depending on what the data shows, the story then adds sentences such as:
- Which playbook carried the edge, and the market condition where you were strongest.
- The condition that cost you money, with a suggestion to stand aside there.
- Your average result in R per trade and the worst drawdown of the period.
- How your planned reward:risk compares with what you actually realize, and what share of each trade's best point you captured.
- Whether you hold losers longer than winners, and how much trades opened within an hour of a loss cost you.
- Whether your P&L is concentrated in a single best day, whether fees are eating a meaningful share of gross profit, and how your checklist adherence held up.
The sentences are deterministic: the same trades always produce the same story, so you can watch it change as your behavior changes.
The charts
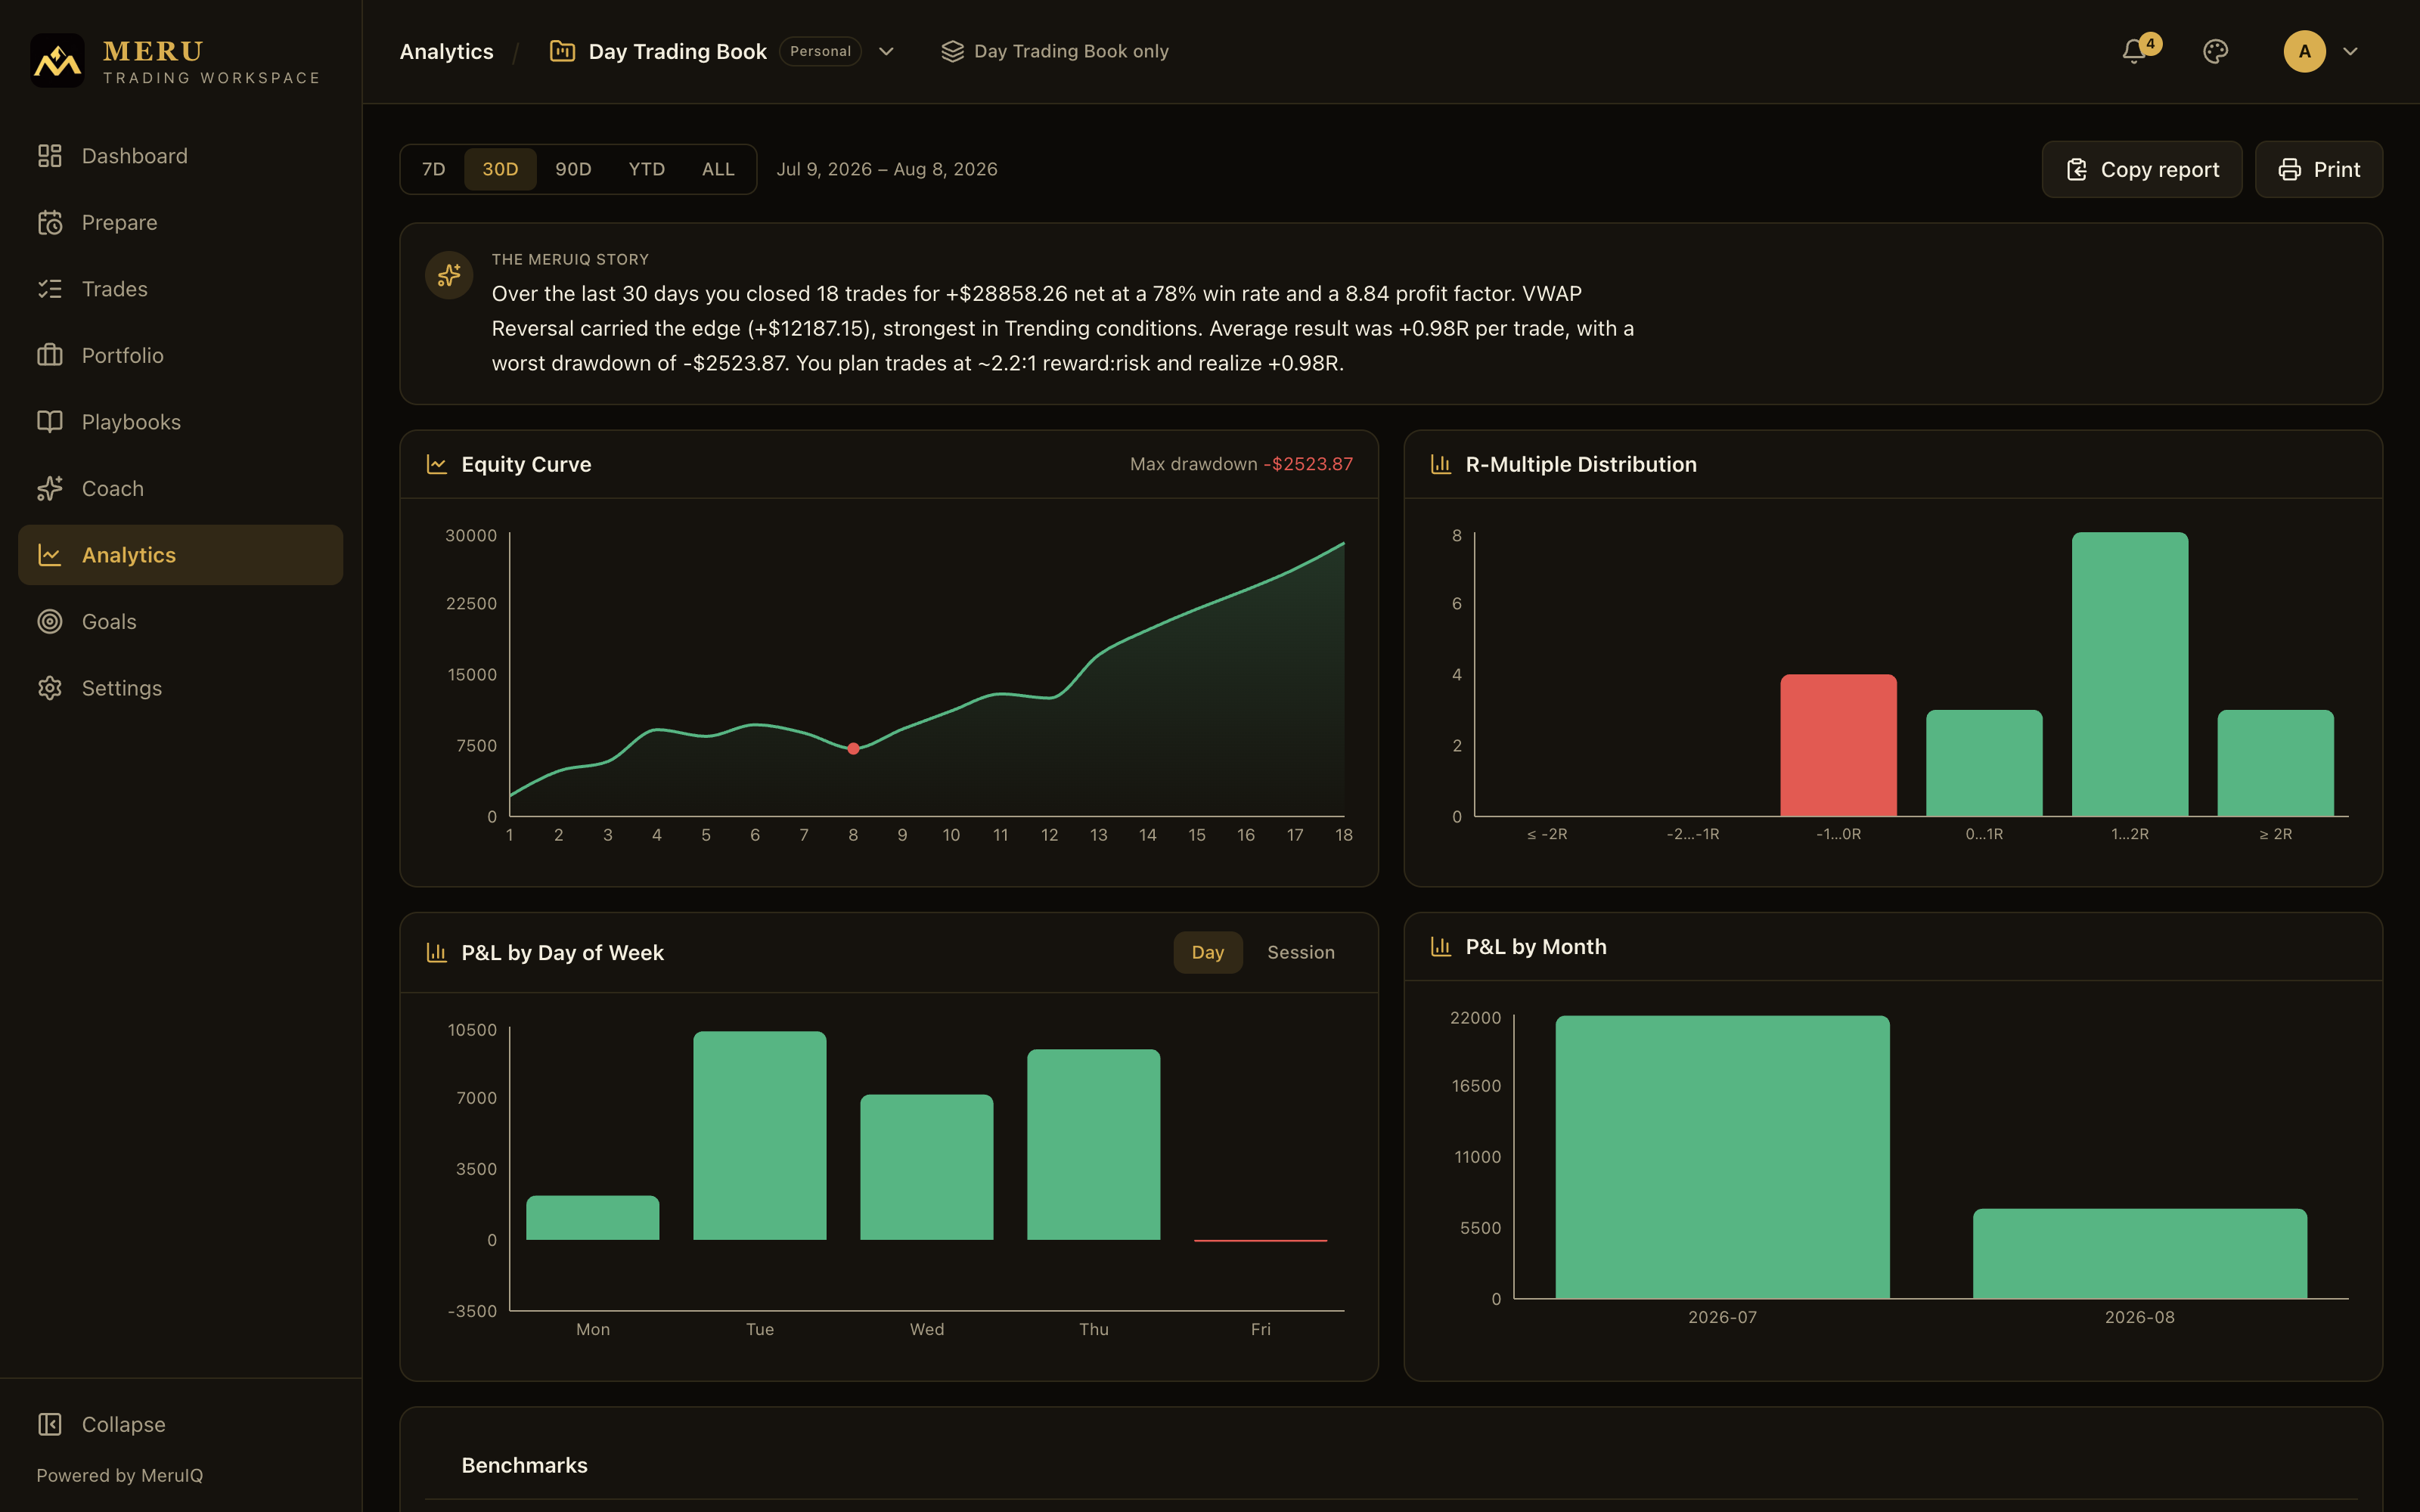
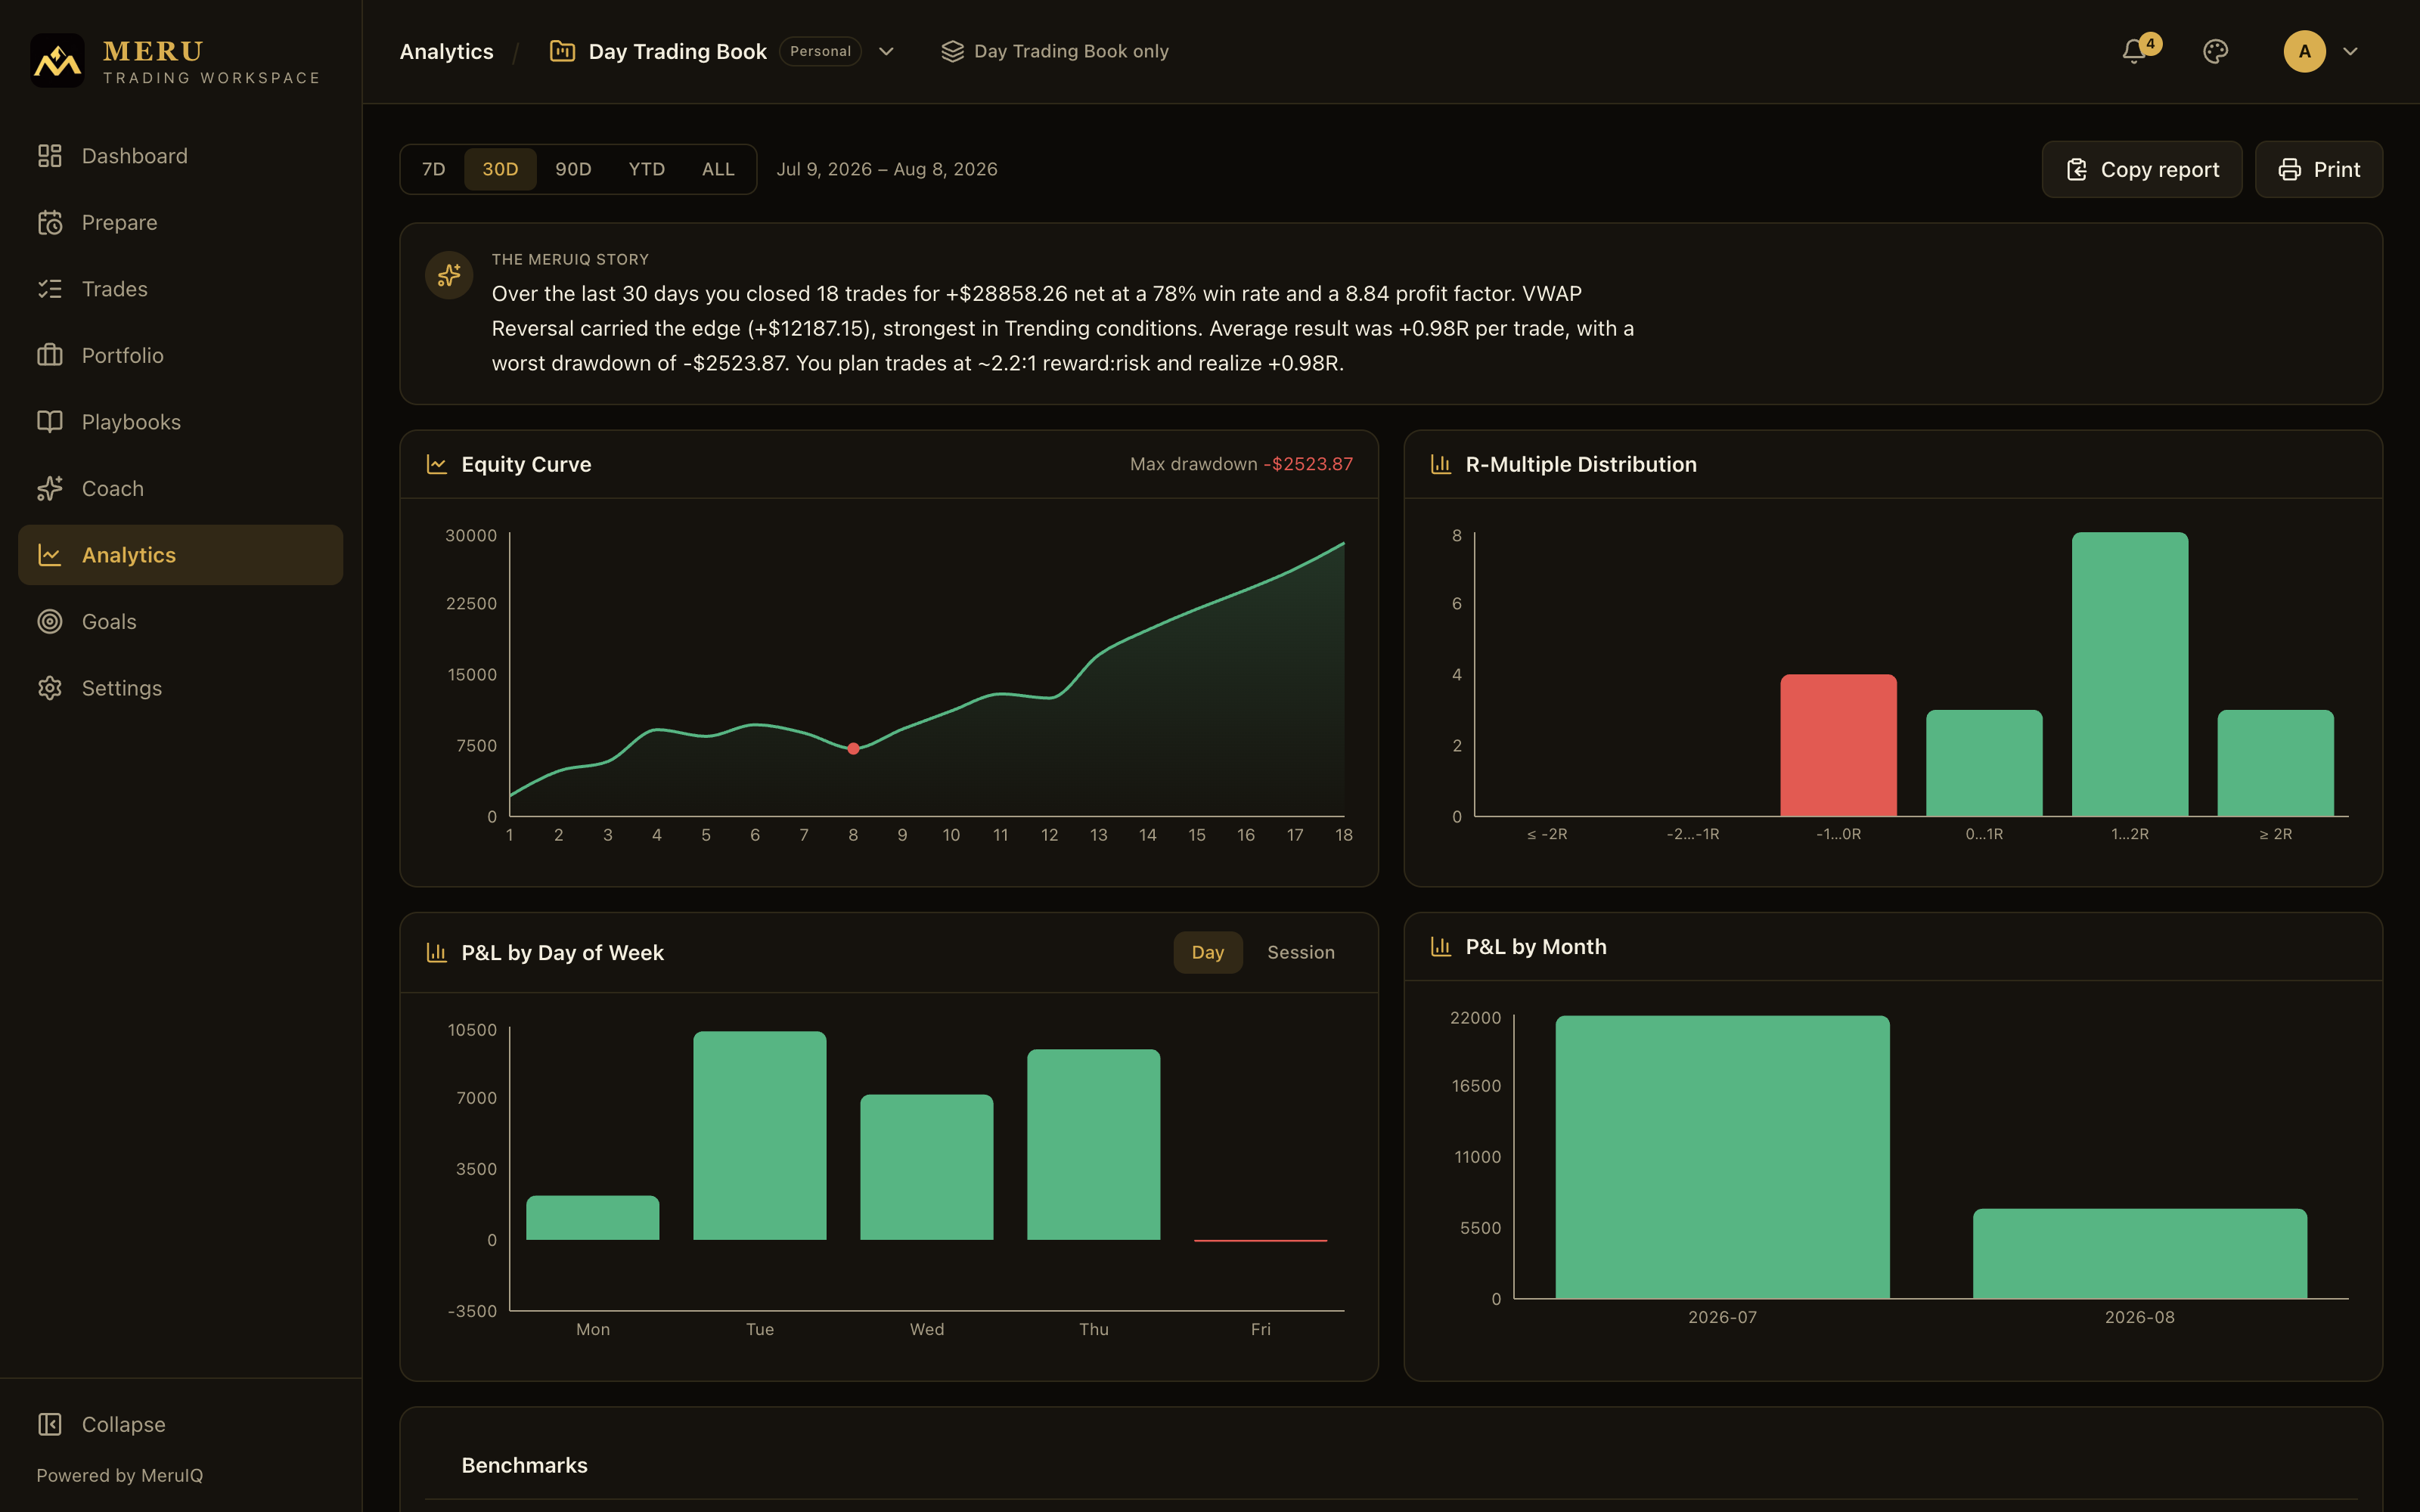
- Equity Curve: cumulative net P&L, trade by trade, through the range. The line is green when the period is positive and red when negative. The card header shows your Max drawdown: the largest peak-to-trough drop of the curve, in money. A red dot marks the exact trade where that low point occurred. Hover any point for the date and equity value.
- R-Multiple Distribution: your closed trades bucketed by result measured in R, from losses of 2R or worse up to wins of 2R or better. A healthy shape has small red bars on the left and taller green bars on the right. R needs a stop: trades recorded without a stop price cannot be measured and are left out, and the card asks you to set stops if no R data exists.
- P&L by Day of Week / P&L by Session: one chart with two modes, switched by the Day and Session buttons. Day mode totals net P&L per weekday. Session mode buckets trades by the clock time you opened them: Pre-mkt, Open, Midday, Power hr, and After. Hover a bar for the amount and trade count.
- P&L by Month: net P&L totaled per calendar month inside the range, most useful on the 90D, YTD, and ALL ranges.
Benchmarks
The Benchmarks card scores this range against the discipline a professional desk would hold, row by row: your number, the target, a pass or fail mark, and a progress meter toward the target.
- Profit factor (gross profit vs gross loss): target at least 1.5.
- Win rate (share of closed trades that won): target at least 50%.
- Payoff ratio (average win vs average loss): target at least 1.2. You can win less than half the time and still profit if this is high enough.
- Plan adherence (checklist completion on entry): target at least 80%. Comes from the pre-trade checklists saved on your trades.
- Stops set (closed trades that had a stop): target at least 90%.
- Exit efficiency (share of the best point captured): target at least 50%. Requires recording the trade's best price reached (MFE) so the workspace can compare it with your actual exit.
- Hold-time discipline (loser hold vs winner hold): target at most 1.5x. Above that you are sitting in losers longer than in winners.
- Loss control (largest loss vs average loss): target at most 2x your average loss. This is where an outsized single loss shows up.
Playbook Guardrails
If trades in the range are linked to playbooks that carry checkable rules (a minimum reward:risk, a max trades per day, intended market conditions, or an instruments list), the Playbook Guardrails card appears and audits every linked trade against its playbook. Until such rules exist, the card stays hidden.
When everything checks out you see a green line: All guardrails respected, with the number of trades checked. Otherwise the card lists each violation with the symbol, the date, and the rule that was broken:
- A planned reward:risk below the playbook's minimum.
- A trade taken in a market condition outside the playbook's intended conditions.
- A symbol that is not on the playbook's instruments list.
- More trades in one day than the playbook's max trades per day allows.
Performance Metrics
The plain numeric summary of the range lives in the Performance Metrics card:
- Net P&L: total profit or loss across the closed trades, net of fees.
- Win rate: the percentage of closed trades that made money, with the win and loss counts underneath.
- Profit factor: every dollar won divided by every dollar lost. 1.00 is break-even, above 1.5 is solid, and the symbol for infinity appears if the range has no losing trades at all.
- Closed trades: how many trades the statistics rest on, with how many positions are open now.
- Average win and Average loss: the typical size of a winner and of a loser.
- Best day and Worst day: your single strongest and weakest trading days in the range, with their dates.
- Win streak and Losing streak: consecutive winning or losing days, counted back from your most recent trading day.
Breakdowns
The same closed trades get sliced by whatever you tagged them with in the Breakdowns card. Switch the grouping with the tabs: Symbol, Side, Strategy, Setup, Market (the market condition tag), Confidence (your 1 to 5 rating at capture), or Tag (your free tags; a trade with three tags counts in three rows). Each group row shows Closed, Win rate, Profit factor, Avg win, Avg loss, and Net P&L, sorted with the most profitable group on top. Trades without the tag for the current grouping get left out, so tagging consistently at capture is what makes this card powerful.
Sharing your results
Two buttons at the top right of the page turn the current range into a report:
- Copy report puts a formatted text report on your clipboard, ready to paste into a chat, an email, or your journal. It contains the period, the full MeruIQ story, the headline numbers (trades, net P&L, fees, win rate, profit factor, average win and loss, average R, max drawdown), the guardrail result, and the benchmark checklist with pass and fail marks. The button briefly reads Copied! to confirm.
- Print opens your browser's print dialog with a print layout that adds a Meru report header (period, scope, and generation date). Use your browser's Save as PDF option to produce a PDF of the page.