
Help Center / Market Prep
Market Prep
The Prepare page is where your trading day starts. Write a plan before the open, stalk candidates on watchlists, run scans over them, and keep an eye on the week's economic releases and the headlines behind your symbols. Preparation is personal, so plans and watchlists live in your own workspace.
The market strip
Across the top of the page, a strip of index ETF quotes gives you the broad tape at a glance: SPY, QQQ, DIA and IWM, each with its last price and percent change, colored green or red. Quotes refresh automatically while the page is open, so you can leave Prepare up through the pre-market.
The date picker
The date field in the top-right corner controls which day's trading plan you're looking at. It defaults to today on your own calendar, so an evening session still opens today's plan rather than tomorrow's. Pick an earlier date to review a past plan and its end-of-day review; pick today again for the current session. Watchlists, the Scanner, the calendar and news are always live and don't change with the date.
The Trading Plan card
The Trading plan card carries your intentions for one day. If no plan exists for the selected date yet, the card offers Start plan to begin from a blank draft, and Copy previous day (shown once you have at least one earlier plan) to carry yesterday's plan forward as a starting point.
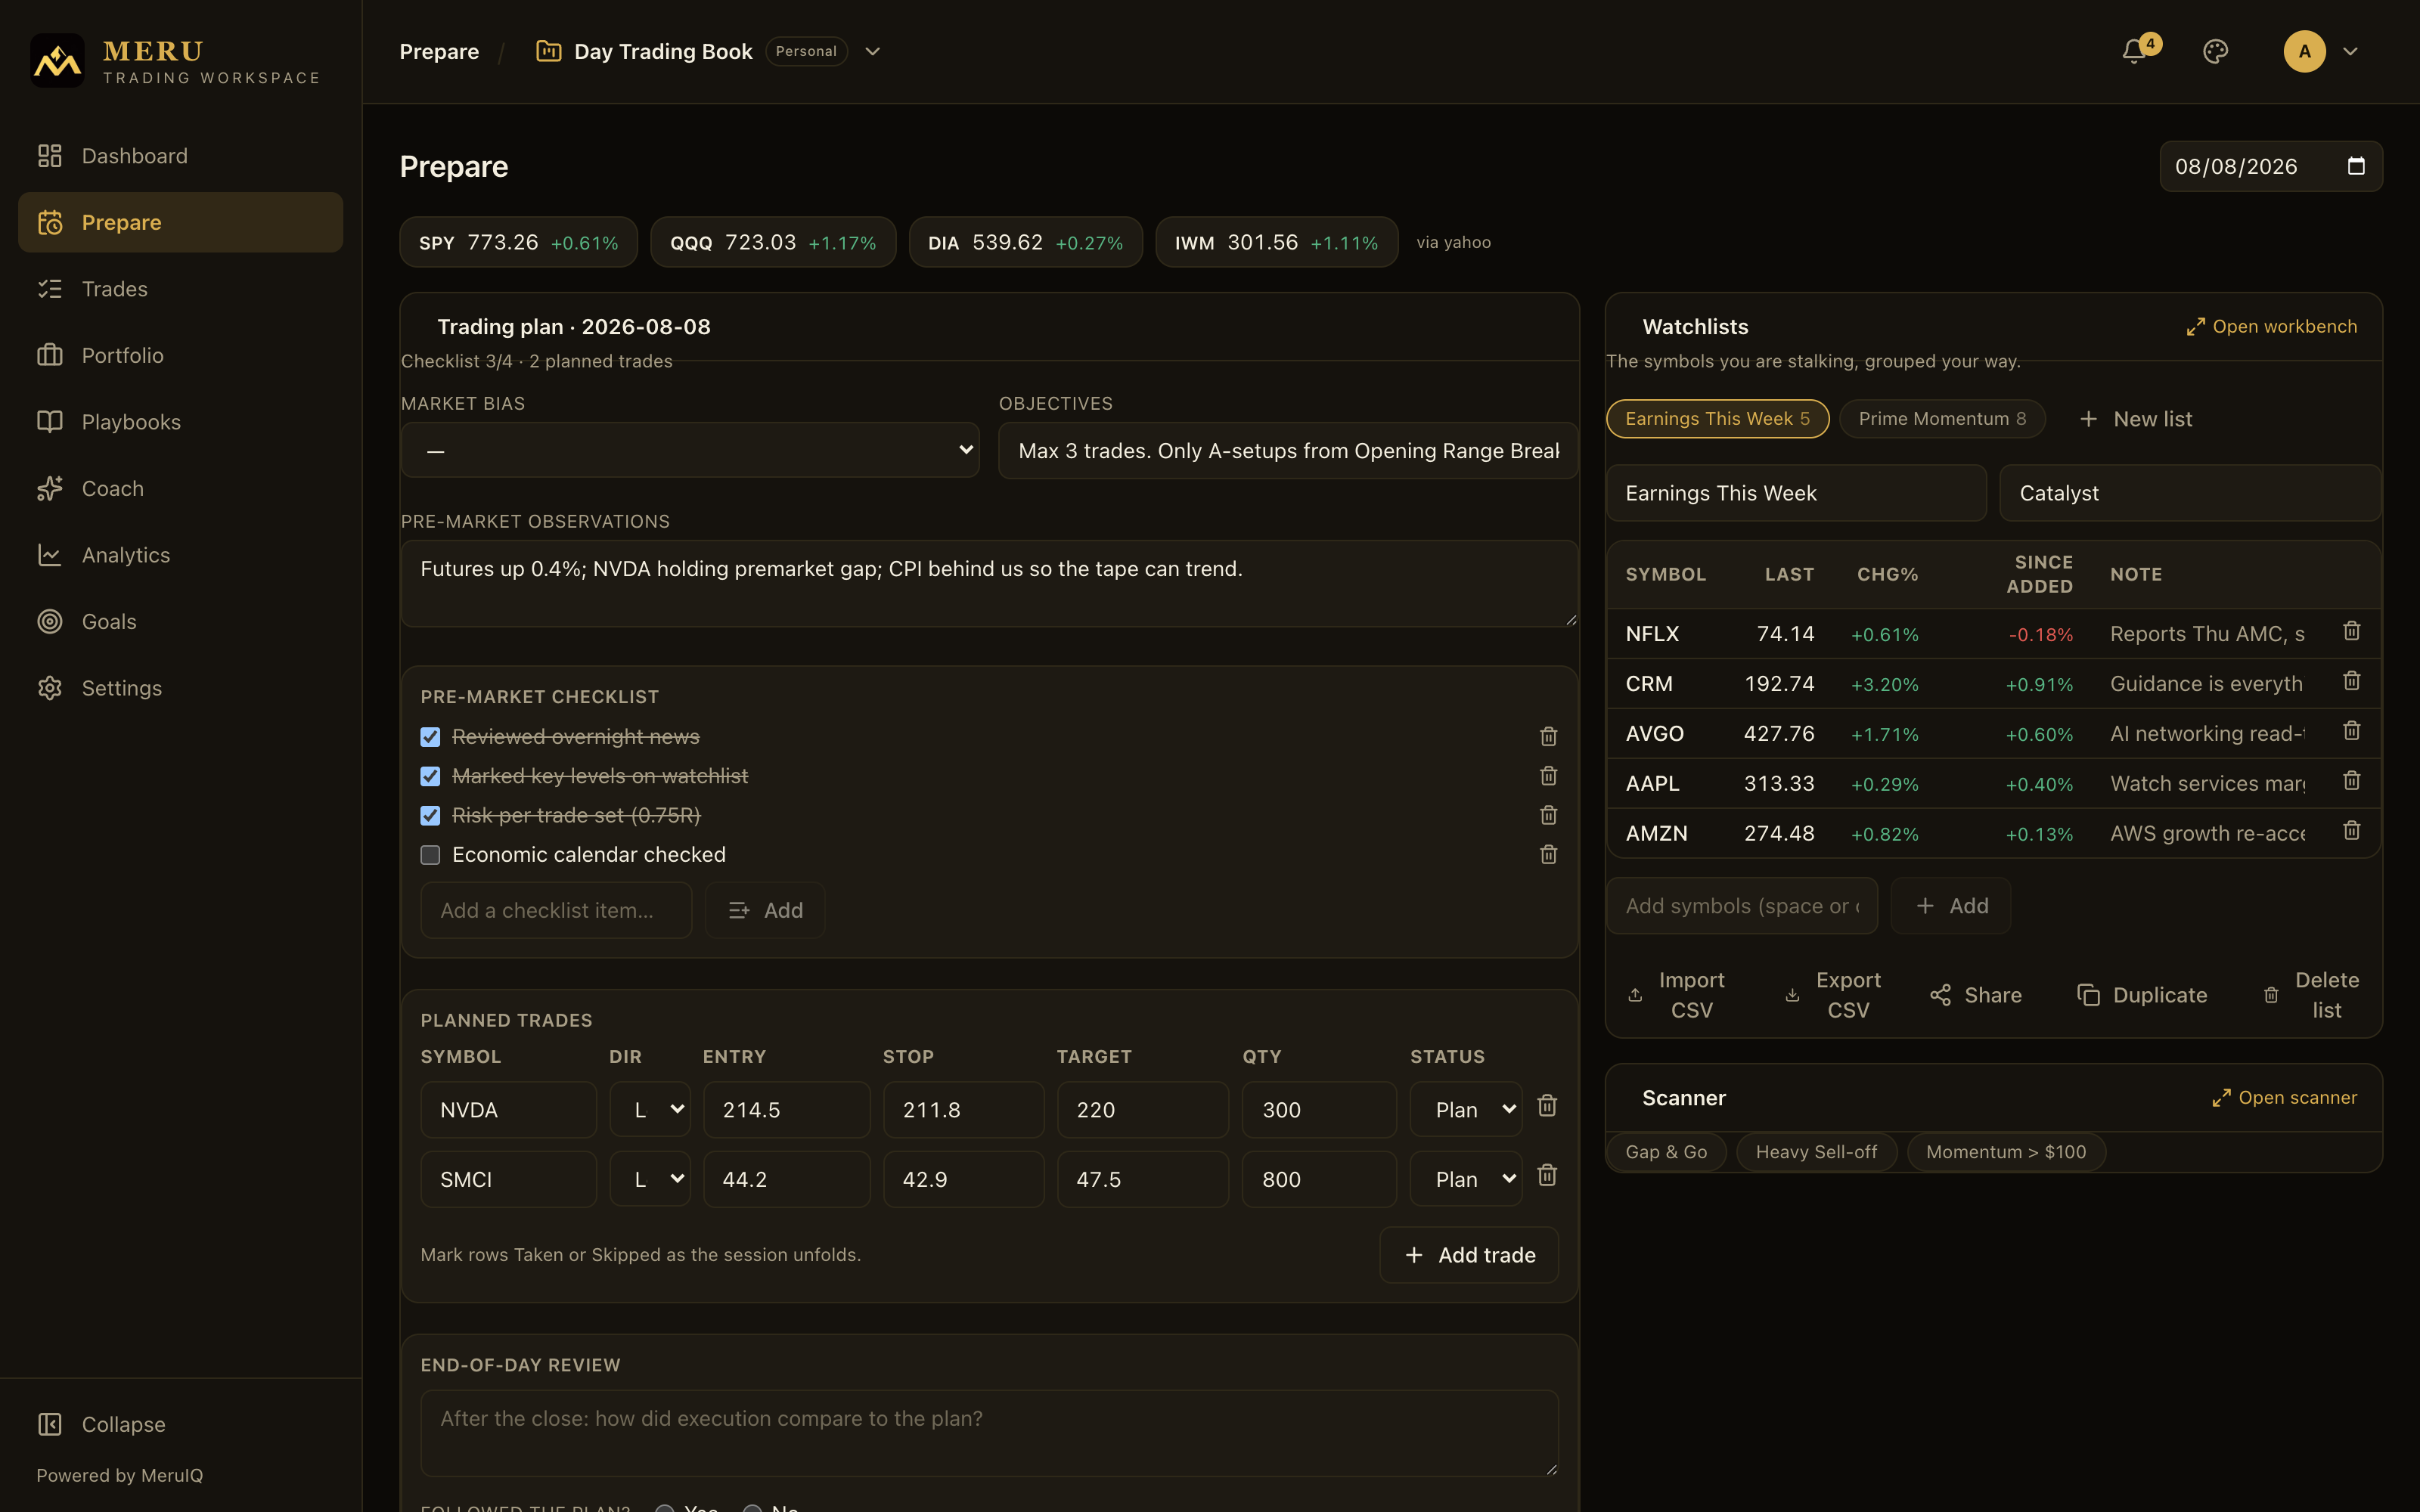
A summary line under the title tracks your progress, something like "Checklist 2/4, 3 planned trades". The card contains, top to bottom:
- Market bias: your read on the day. Choose Bullish, Bearish, Neutral or Choppy.
- Objectives: a one-line intention for the session, such as "Two A+ setups max, stop at -$500".
- Pre-market observations: free text for futures, gaps, catalysts and key levels you noticed before the open.
Pre-market checklist
Every new plan starts with the same four seed items on the Pre-market checklist: review the economic calendar, check pre-market movers and gaps, review open positions and orders, set max daily loss and position size. Edit the list until it matches how you actually prepare.
- Type a new item into Add a checklist item… and press Add. It appears at the bottom of the list.
- Tick an item's checkbox as you complete it. Done items are crossed out and count toward the "Checklist n/n" summary.
- Click the trash icon at the right of an item to remove it from this day's plan.
Planned trades
Levels you decided on before the open live in the Planned trades table. Press Add trade to add a row, then fill in:
- Symbol: the ticker (typed symbols are uppercased for you).
- Dir: Long or Short.
- Entry, Stop, Target: your price levels.
- Qty: the intended size.
- Status: starts as Planned. Mark rows Taken or Skipped as the session unfolds, so the evening review compares intention to execution.
The trash icon at the end of a row removes that planned trade.
End-of-day review
After the close, come back to the same card. The End-of-day review box asks how execution compared to the plan. Write a short summary, then answer Followed the plan? with Yes or No. Over time that yes/no record turns into one of the most useful discipline signals in your journal.
Saving, copying and deleting
- Whenever you edit the plan, an Unsaved changes marker appears. Press Save plan to store the day.
- Use Copy previous day from an empty day to start from your most recent plan instead of a blank one.
- Delete plan removes the whole day after a confirmation. The checklist and planned trades go with it.
Watchlists
The symbols you're stalking live in the Watchlists card, grouped however you like. How many lists, symbols per list, saved scanners and planned trades per day you can keep depends on your plan (see What each plan includes); a cap is only ever applied when you add past it, never to what you already have. Each list shows up as a chip with its name and symbol count: click one to select it. Press New list to start one (it's called "New watchlist" until you rename it).
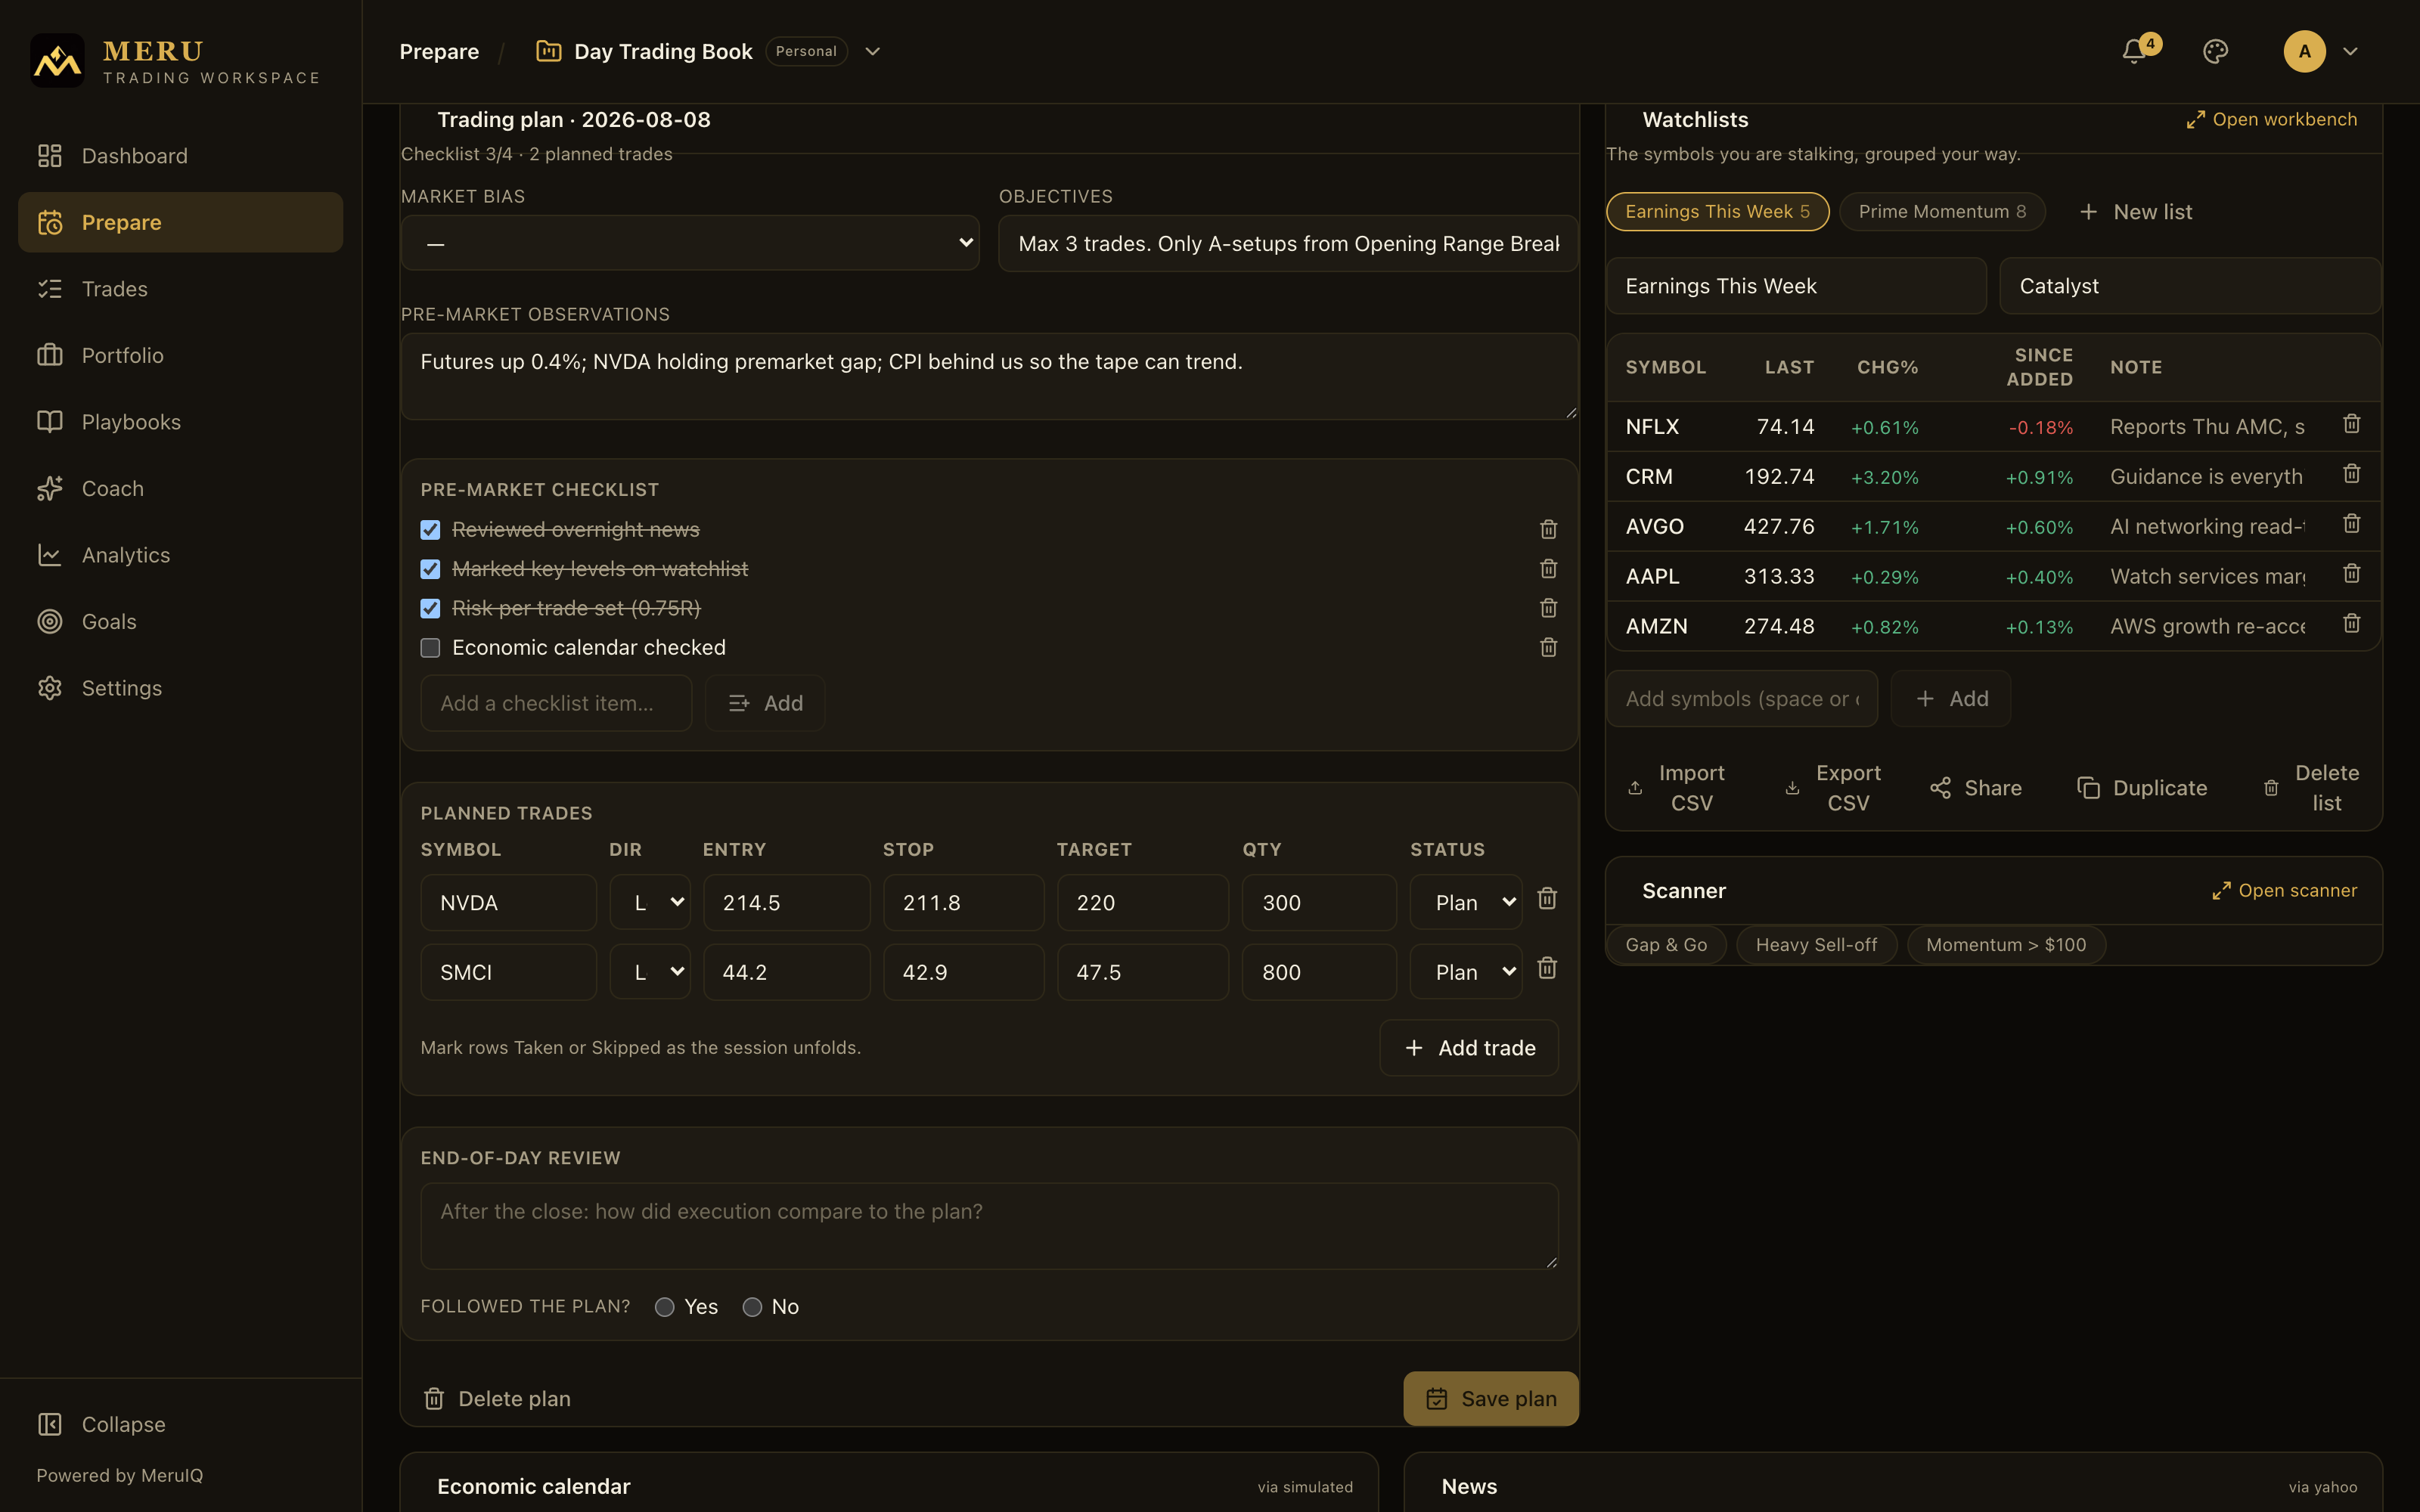
With a list selected you can:
- Rename it in the Watchlist name field, and give it a Category (for example "Momentum") to group related lists. Both save when you leave the field.
- Add symbols: type tickers into Add symbols (space or comma separated)… and press Add. You can paste several at once; duplicates already on the list are skipped.
- Write a per-symbol Note directly in the table row (the thesis: why is it on the list?). Notes save when you leave the field.
- Remove a symbol with the trash icon at the end of its row.
The table shows live quote columns for every symbol: Last, Chg% (today's percent change) and Since added (how far the symbol has moved since the day you put it on the list). A TARGET badge highlights symbols whose price target has been hit, a bell icon marks symbols whose alerts are muted, and a "stale" marker flags symbols that have sat on the list over a week with no target or note. When a company changes its ticker, the row follows it: it is quoted under the new symbol, its alerts keep firing, and a now KOF pill explains the change (hover it for Now trades as KOF, quoted under that name). Click any symbol to open its insight quick-view (described under the Workbench below).
Import CSV and Export CSV
Export CSV downloads the selected list as a two-column file (Symbol, Note). Import CSV reads the same shape back in: first column symbol, optional second column note. A header row named Symbol or Ticker is skipped automatically, and symbols already on the list are left untouched, so importing is always additive.
Sharing a watchlist
Press Share to open the share dialog for the selected list.
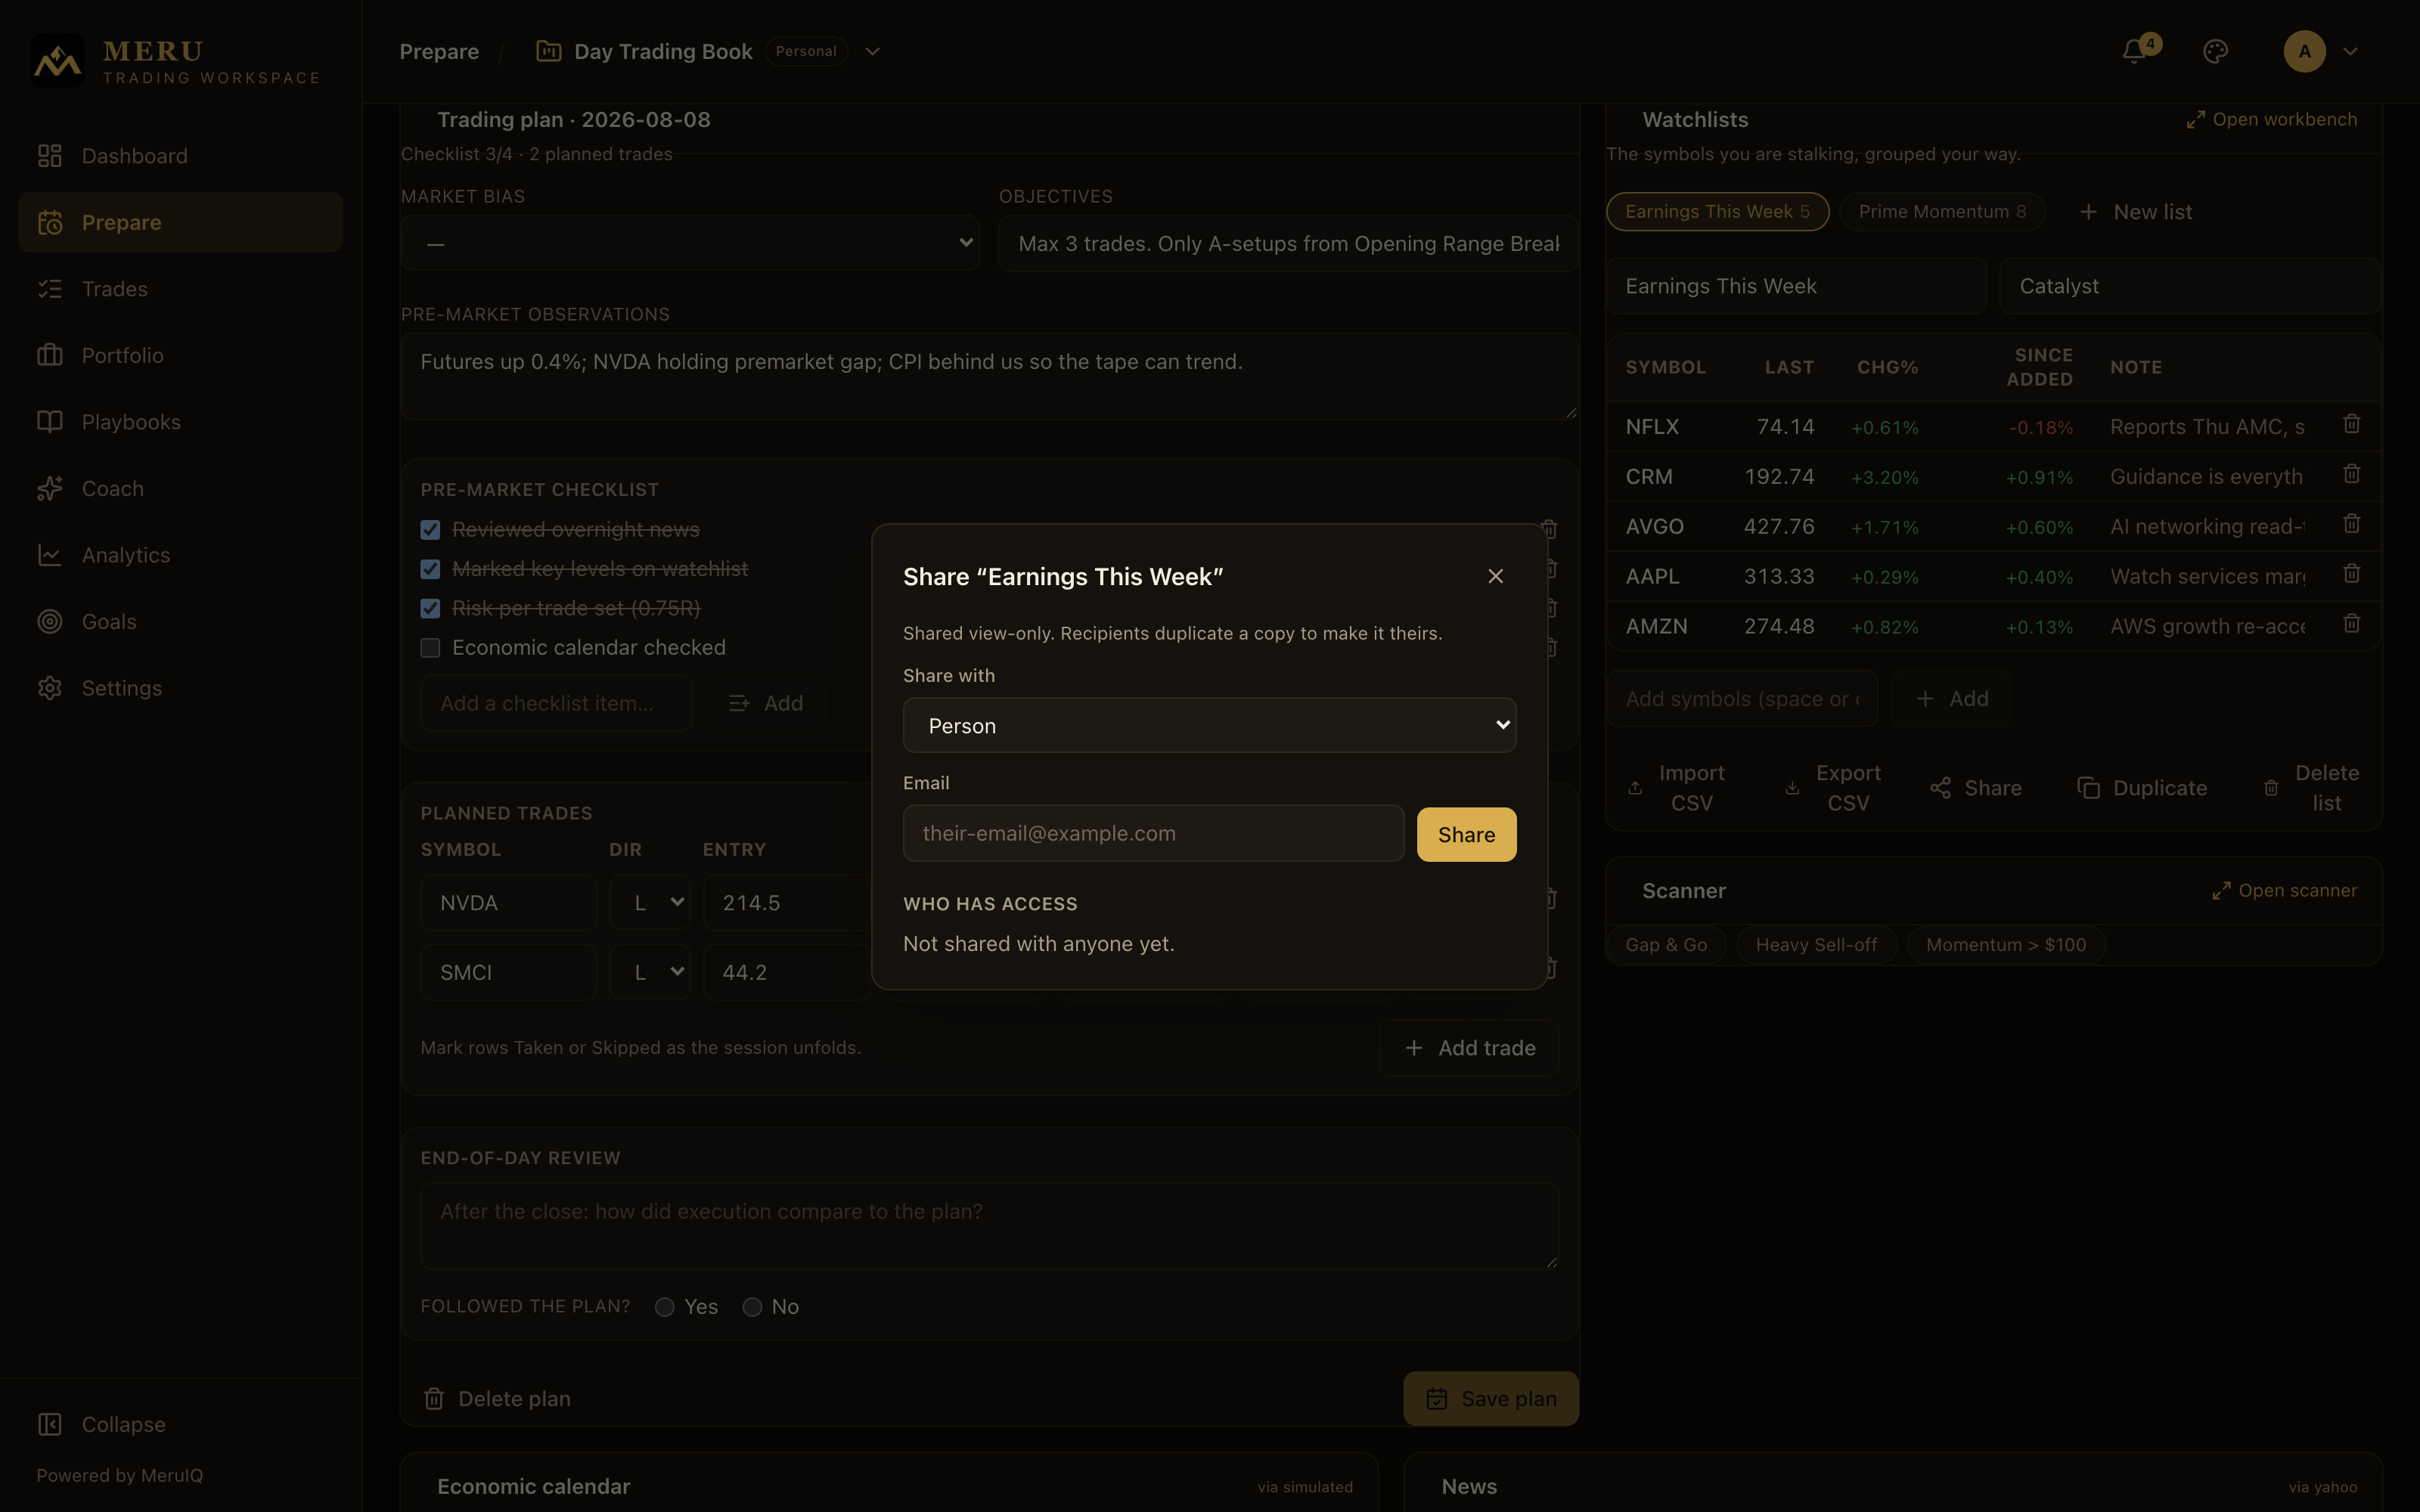
- Under Share with, choose Person, Desk or Organization.
- For a person, enter their Email; for a desk or organization, pick one from the list. Press Share.
- The Who has access section lists everyone the list is shared with, each marked view only. Press Revoke next to an entry to withdraw access.
Duplicate and Delete list
Duplicate creates a copy of the selected list under your own lists, useful for splitting a list or forking a shared one. Delete list removes the list after a confirmation; its symbols, targets and alerts go with it.
The Watchlist Workbench
The card on Prepare stays deliberately compact. For the full picture, click Open workbench in the card header (or go to Prepare, then Watchlists). The Watchlist Workbench is the full-width insight table: every decision column at once, sortable, so you can weigh candidates against each other. Everything the card can do is here too: list chips, New list, name and Category fields, the add-symbols field, Import CSV, Export CSV, Share, Duplicate and Delete list.
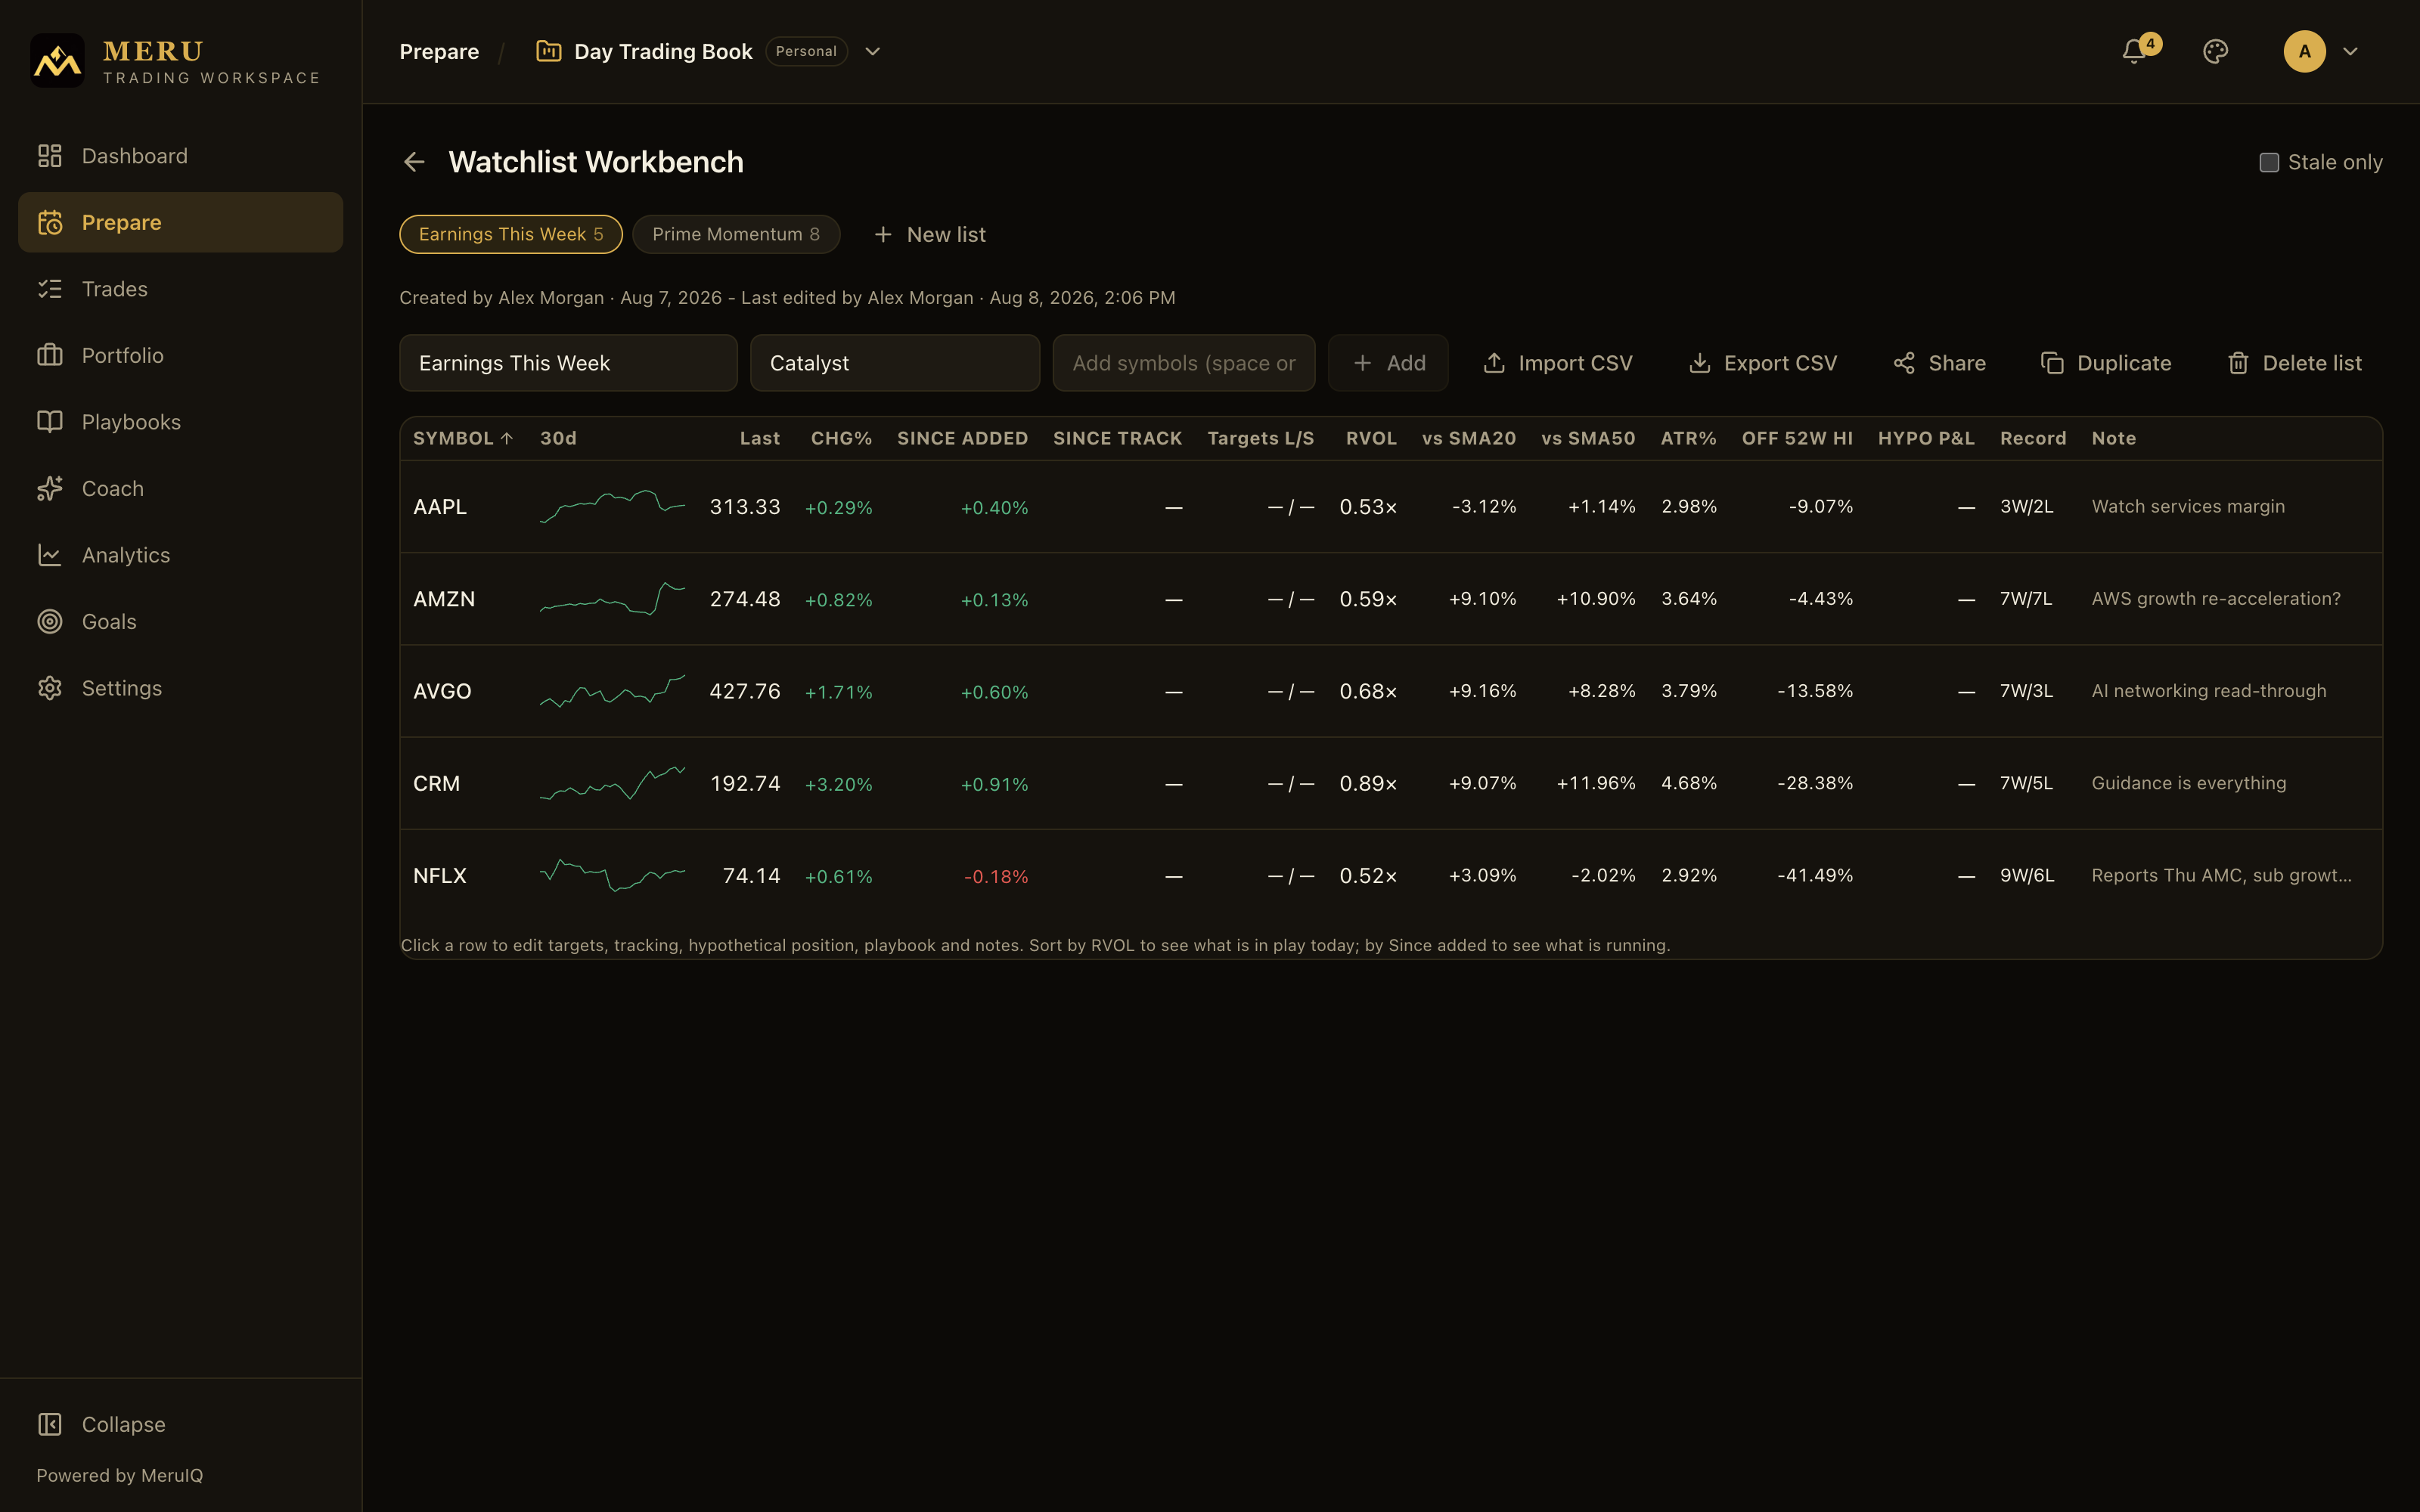
Each row is one symbol with these columns:
- Symbol: with the TARGET badge and "stale" marker where they apply.
- 30d: a 30-day price sparkline.
- Last and Chg%: current quote and today's move.
- Since added and Since track: performance since the symbol joined the list, and since your tracking anchor (see the quick-view below).
- Targets L/S: your long and short price targets, with a bell icon when alerts are muted.
- RVOL: relative volume, how today's volume compares to normal. Sort by RVOL to see what is in play today.
- vs SMA20 and vs SMA50: distance from the 20- and 50-day moving averages, your trend context.
- ATR%: 14-day average true range as a percent, a quick volatility gauge.
- Off 52w hi: distance below the 52-week high.
- Hypo P&L: profit or loss on your hypothetical "what if I had bought" position, if you set one.
- Record: your own trading history on the symbol as wins/losses (for example 3W/1L).
- Note: the symbol's note or thesis.
Click a column header to sort; click again to reverse. The Stale only checkbox at the top filters the table down to symbols that need attention: on the list over a week with no target and no note.
The symbol quick-view
Click any row in the Workbench (or a symbol in the Watchlists card) to open the symbol's insight dialog. It shows the last price and day change, your record on the symbol, the sparkline, and stat tiles for Since added, Since tracking, Off 52w high, Off 52w low, Rel. volume, vs SMA20, vs SMA50 and ATR (14d). From here you can also edit everything about the symbol:
- Restart tracking: sets a fresh tracking anchor at today's price, so Since track measures from a date of your choosing rather than from when the symbol was added.
- Targets & alerts: set a Long target, a Short target and a Day move ±% threshold.
- What if I had bought?: enter On date and Amount ($) and the platform tracks what that hypothetical position would be worth now. It is a thought experiment, not a real position.
- Playbook: link the symbol to one of your playbooks.
- Note / thesis: the same note shown in the tables.
Press Save symbol to store your changes, or Cancel to close without saving.
The Scanner
Saved scans show up as chips on the Scanner card; click Open scanner (or a chip) for the full page. The Scanner runs saved criteria over your watchlist symbols, so it searches the universe you already care about, not the whole market.
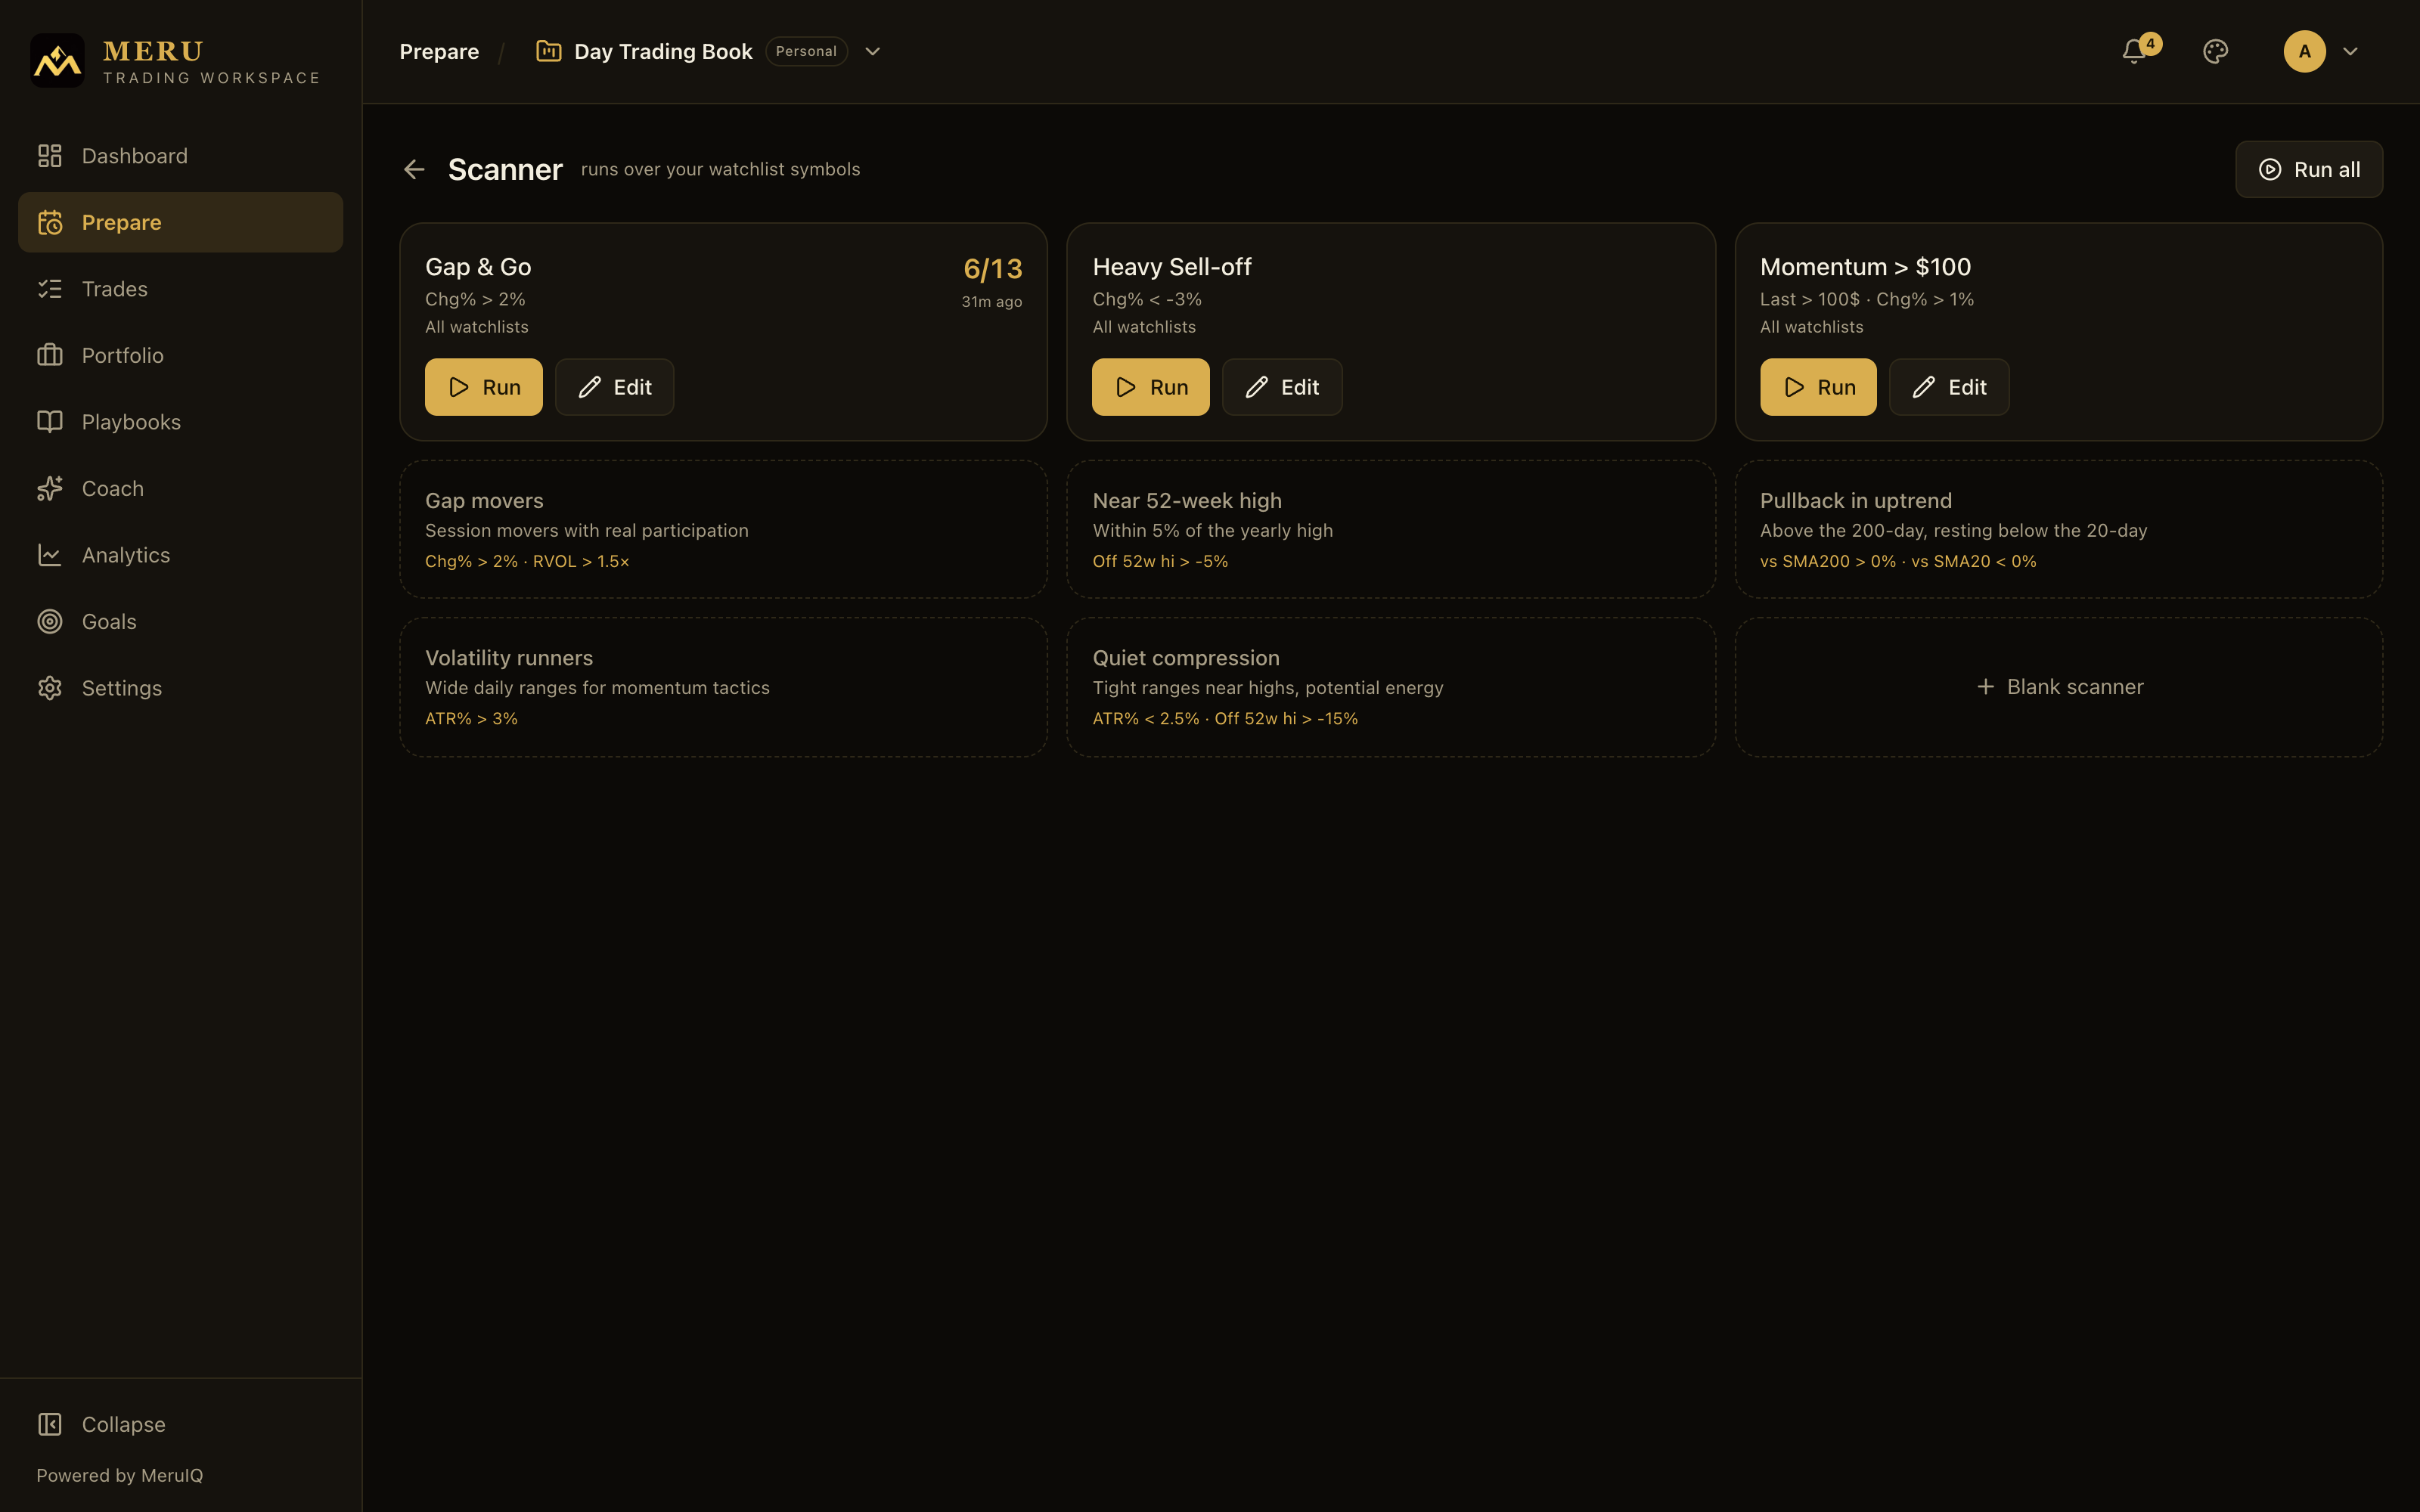
Each saved scanner appears as a card showing its name, a summary of its conditions, the universe it scans, and its last run: a match count like 4/23 (matches out of universe) and how long ago it ran. On a card, Run executes that scanner now and Edit opens it in the editor. The Run all button at the top runs every saved scanner in one go, a handy morning routine that refreshes every card's match count. Template cards (for example Gap movers or Near 52-week high) start a new scanner pre-filled with sensible conditions, and Blank scanner starts from scratch.
Reading the results
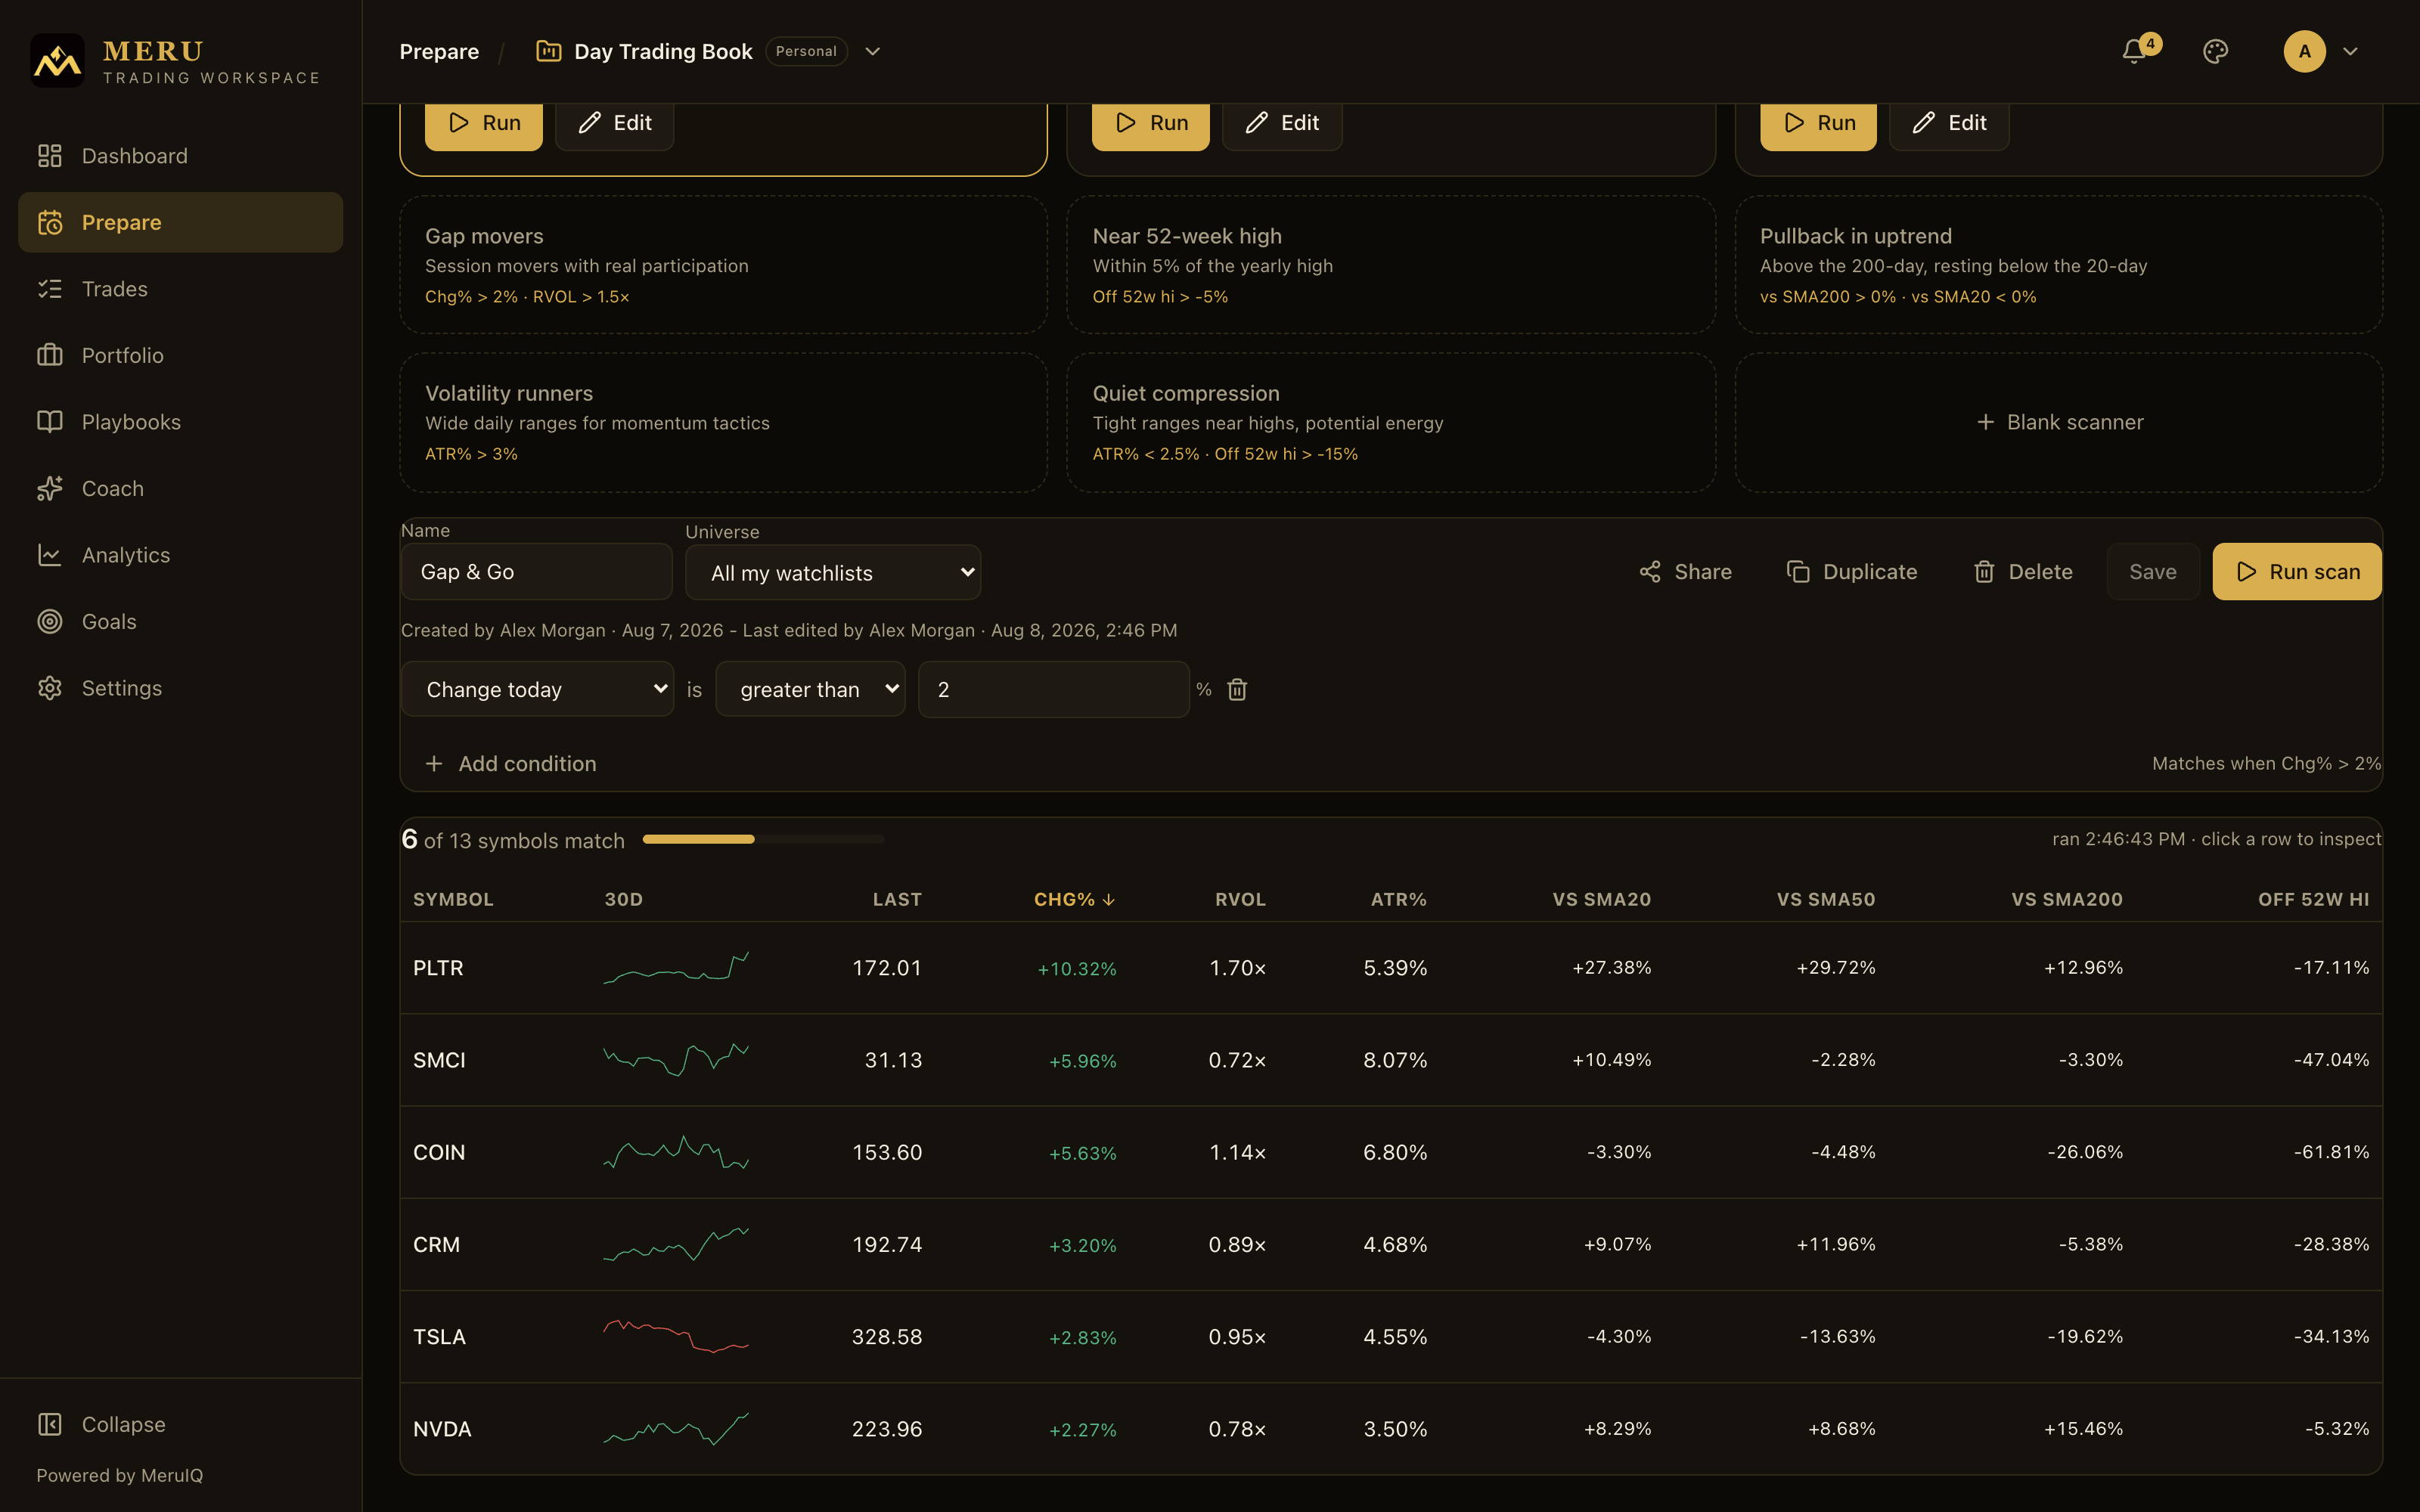
After a run, the results card leads with the count, for example "6 of 23 symbols match", a proportion bar, and the run time. Below it, one row per matching symbol with a 30d sparkline and the metric columns: Last, Chg%, RVOL, ATR%, vs SMA20, vs SMA50, vs SMA200 and Off 52w hi. Column headers that your conditions use are highlighted, and the sortable headers reorder the table on click. Click a row to open a quick-view of the symbol: its price, sparkline and stat tiles, plus an Add to watchlist row of buttons that puts the scan hit straight onto one of your lists.
Editing a scanner
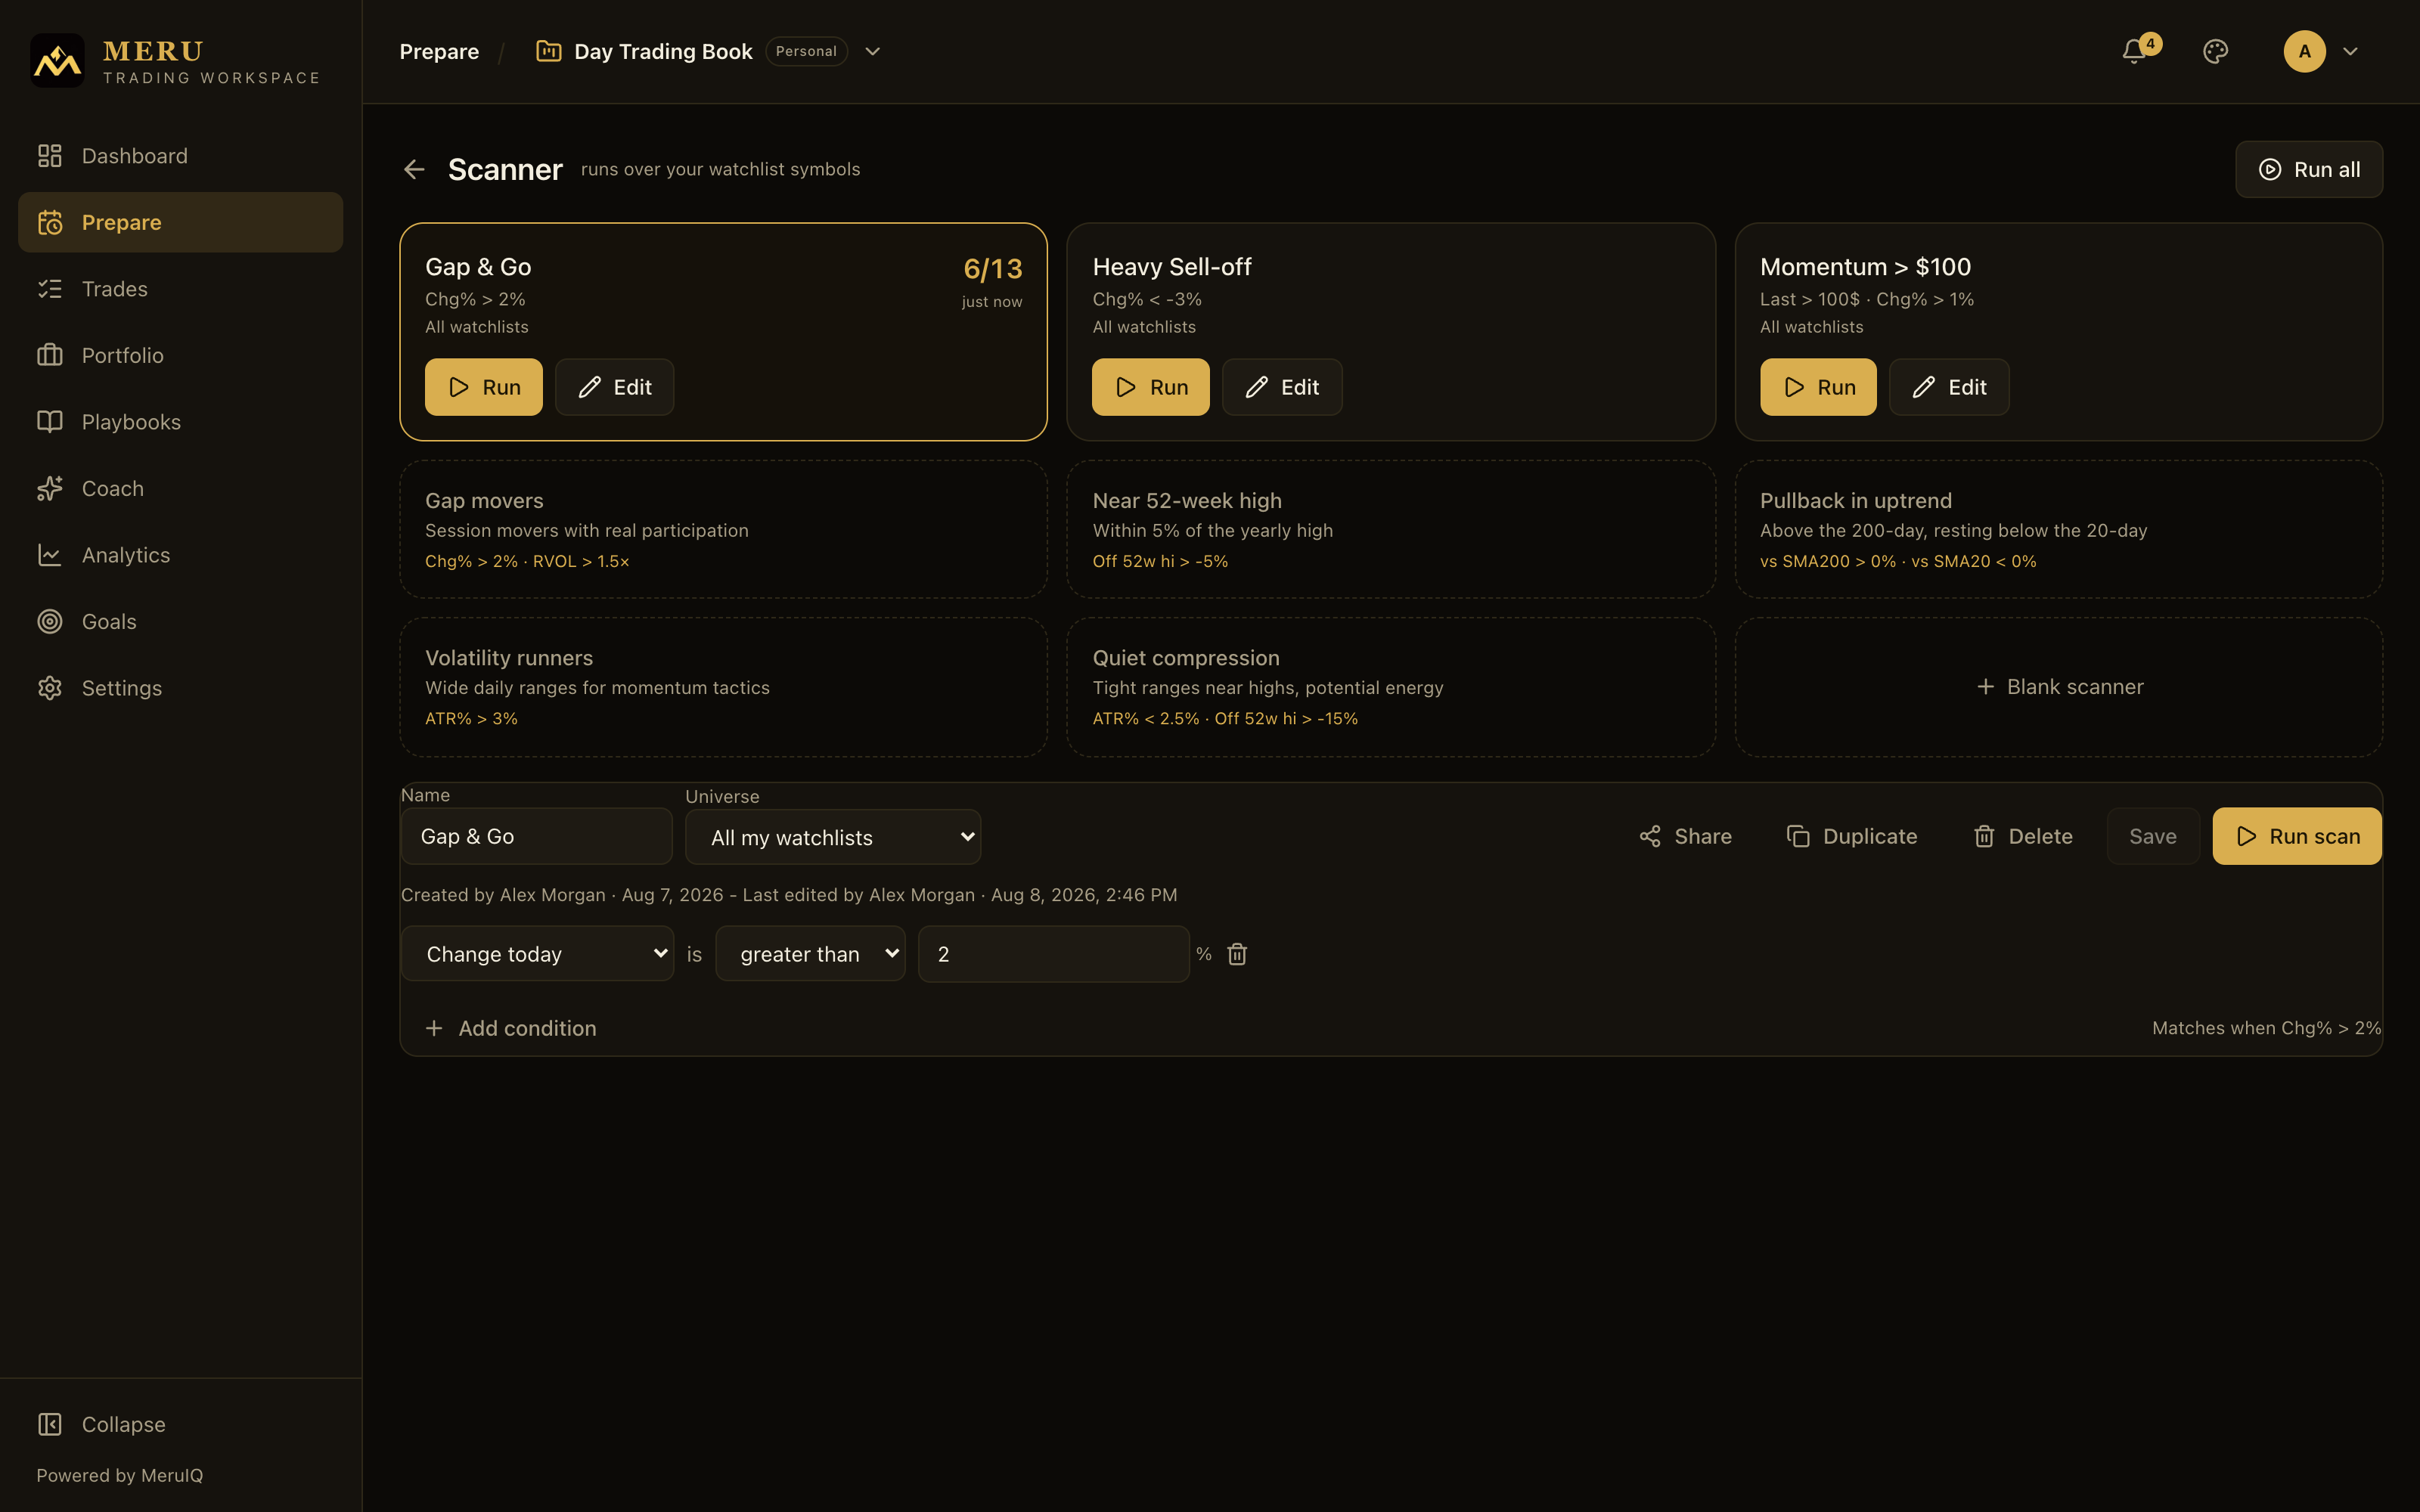
- Give the scanner a Name.
- Pick the Universe: All my watchlists, or a single list.
- Build conditions. Each row reads as a sentence: a metric, is, greater than or less than, and a value. Available metrics: Change today, Relative volume, ATR (14d), Distance vs SMA20, Distance vs SMA50, Distance vs SMA200, Off 52-week high, Off 52-week low and Last price.
- Press Add condition for more rows, or the trash icon to remove one. All conditions must hold for a symbol to match; a live "Matches when …" preview under the rows spells out the combined rule.
- Press Save to store the scanner, or Run scan to save and execute in one step.
The editor toolbar also offers Share (the same view-only share dialog as watchlists), Duplicate to fork a copy, and Delete, which removes the scanner and its saved runs after a confirmation. A scanner shared with you shows View criteria and Duplicate to mine instead of Run and Edit: a shared scanner never runs in place, because its universe is the owner's watchlists. Duplicate it, and your copy scans your own lists.
Targets and alerts
The targets you set in the symbol quick-view do more than color a column. When a symbol crosses its Long target or Short target, or moves more than its Day move ±% threshold in a day, you get a notification and the symbol is highlighted with the TARGET badge in the watchlist and Workbench tables. Each alert notifies once; edit the target to re-arm it.
Economic calendar
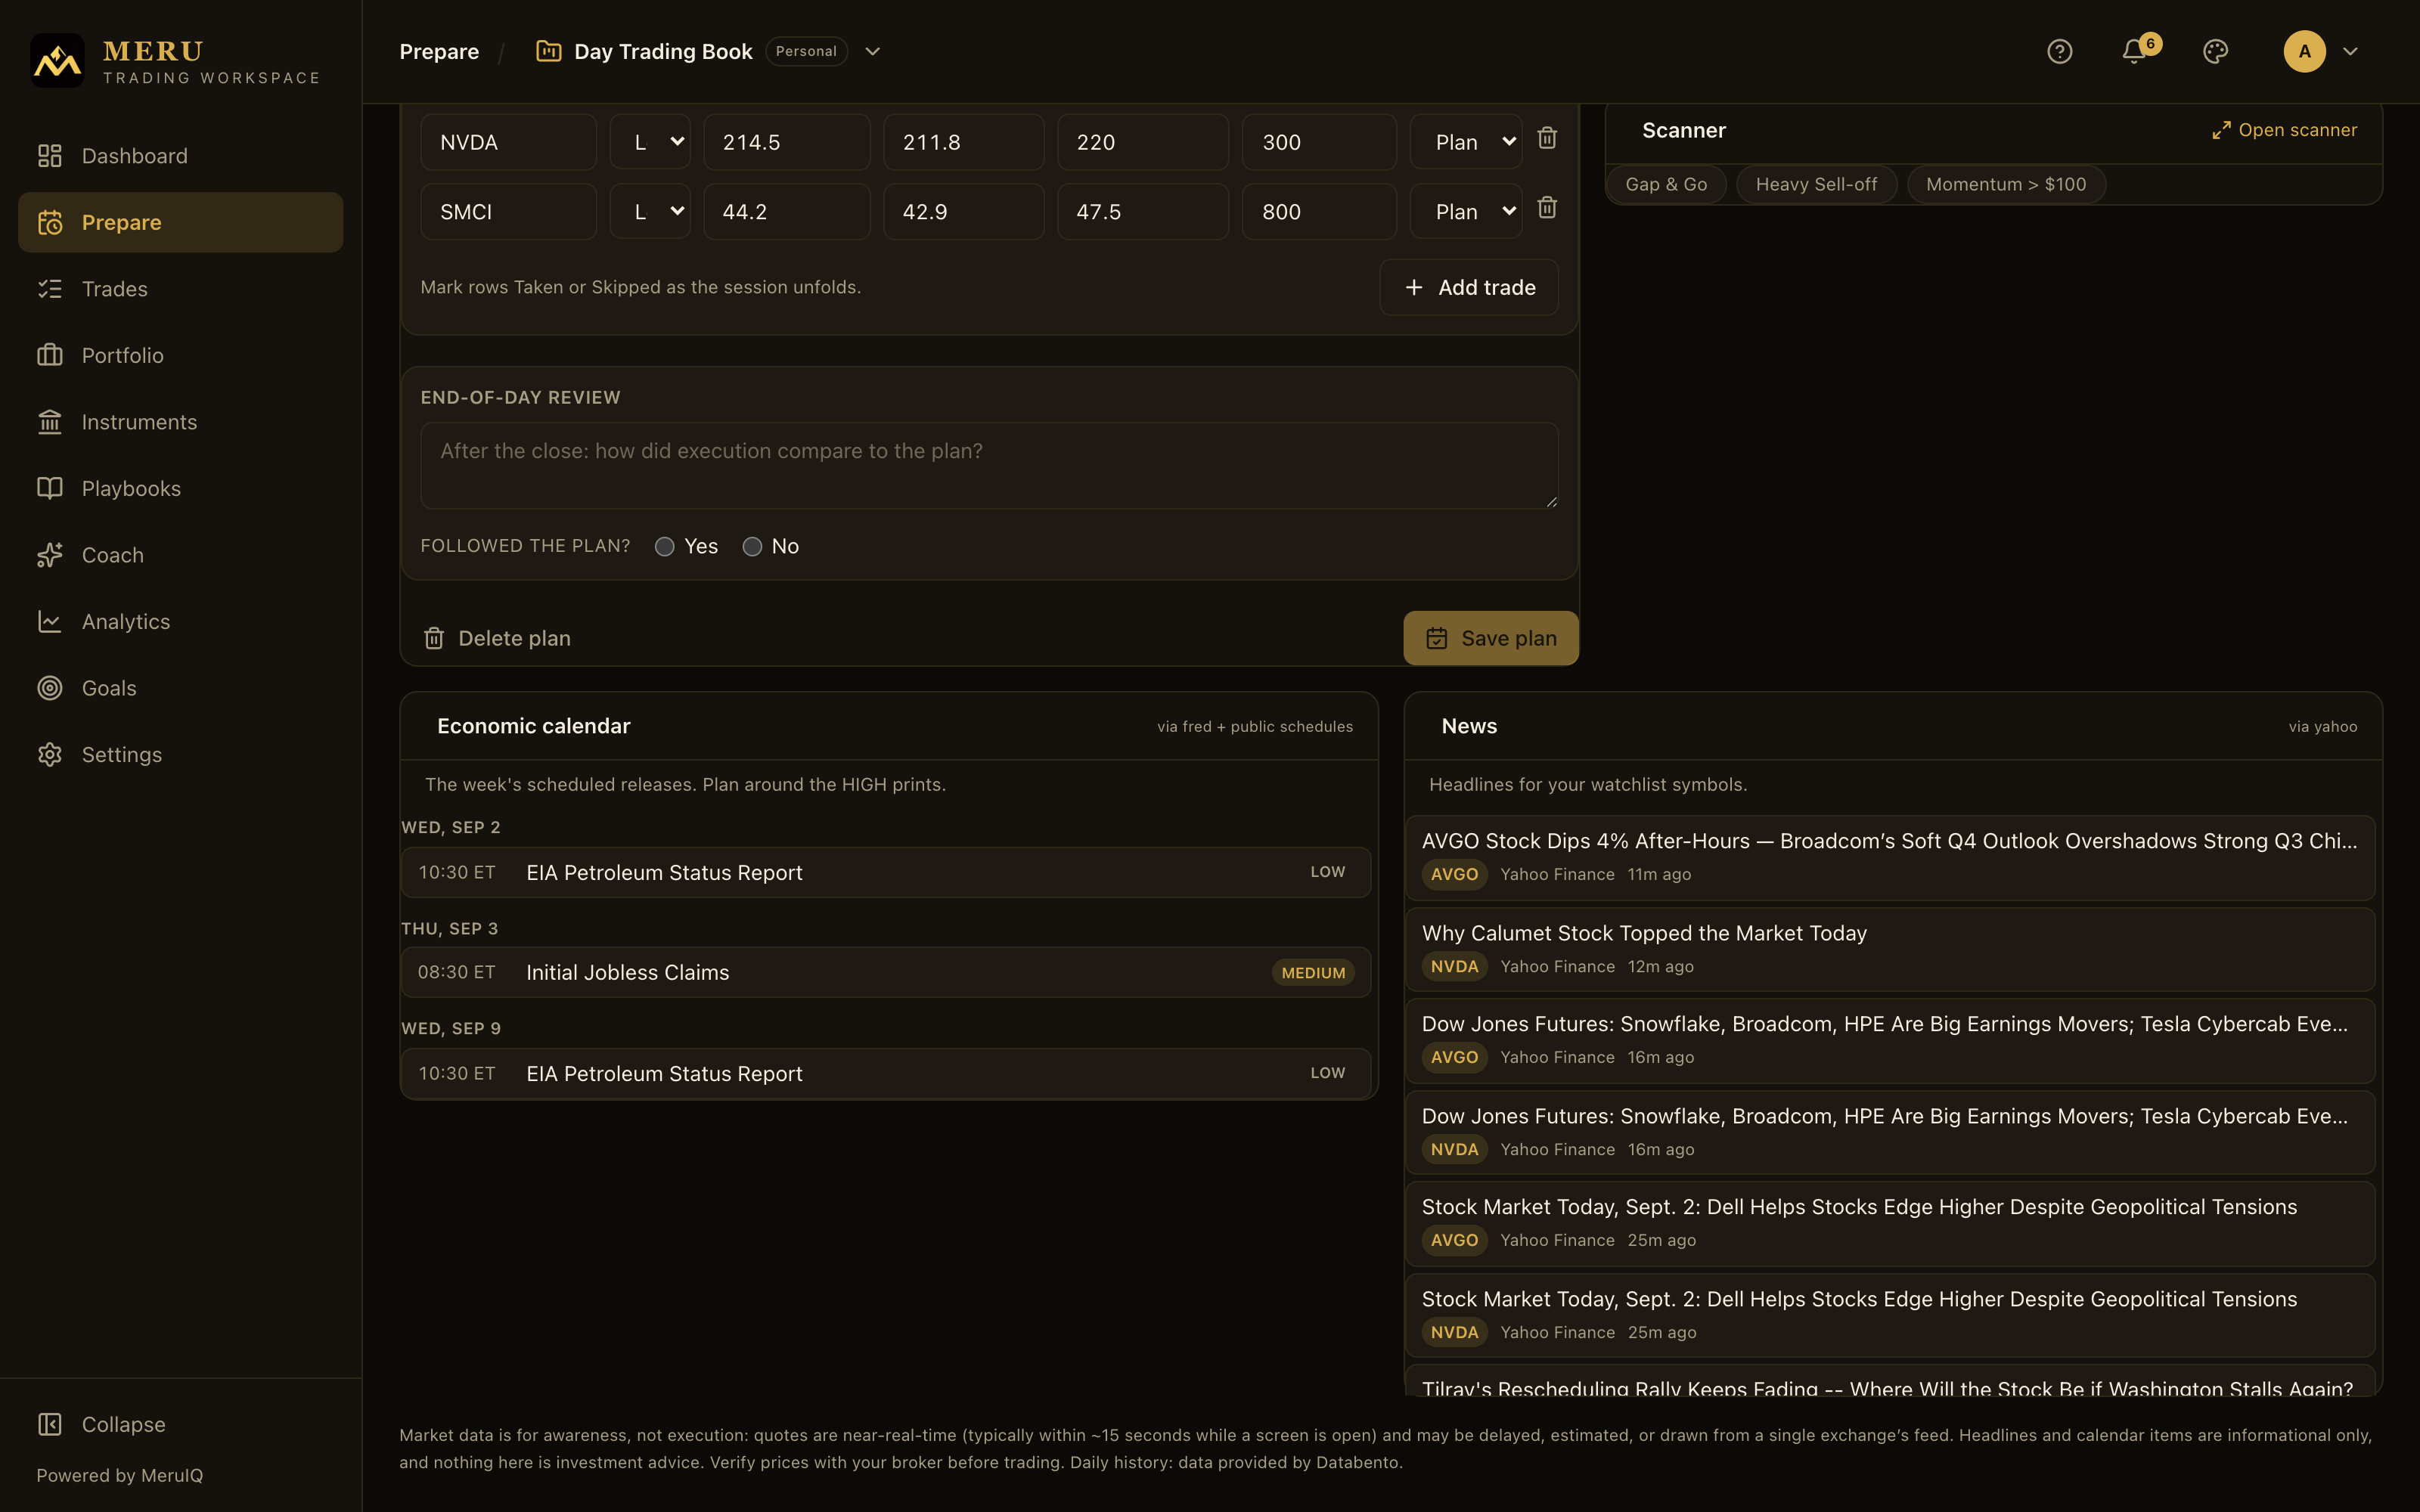
At the bottom of Prepare, the Economic calendar card lists the week's scheduled releases, grouped by day. Each entry shows its time (Eastern), title and an importance badge (HIGH, MEDIUM or LOW). Plan around the HIGH prints: they're the ones that move the tape. A small via label in the header names the source.
The calendar only claims what it can source. FOMC Rate Decision dates (marked + Projections at the meetings that publish a Summary of Economic Projections) come from the Federal Reserve's own published schedule. The weekly Initial Jobless Claims (Thursday 8:30) and EIA Petroleum Status Report (Wednesday 10:30) follow their standing rhythm, and are dropped on federal holidays, which the platform derives from statute rather than from a list. Where the deployment reads the St. Louis Fed's FRED release calendar, the label reads via fred + public schedules and the month's CPI, Employment Situation (Payrolls), PCE, GDP, PPI and Retail Sales dates appear as well. Forecast and consensus figures are not shown, because no free source publishes them reliably; check the print itself when it lands.
News
Next to the calendar, the News card shows recent headlines focused on your watchlist symbols; with no watchlists yet, it falls back to market-wide headlines. Each item shows its symbol tag, source and age, and opens the full story in a new tab. The feed refreshes itself every few minutes, so the card stays current through the pre-market.