
Help Center / Portfolio
Portfolio
The Portfolio page marks every open position to market and answers two questions at a glance: what is deployed right now, and what could be lost if it all goes wrong. It follows the workspace toggle in the header, like Trades and Analytics: the active workbook alone, or every workbook when All workspaces is on. It then breaks realized results down by workbook, symbol, and strategy. As the page header says: analytical context only, execution stays at your broker. The Workspace never places, modifies, or closes orders.
The exposure strip
Six tiles across the top summarize your whole book. Each tile carries a short caption explaining what it measures:
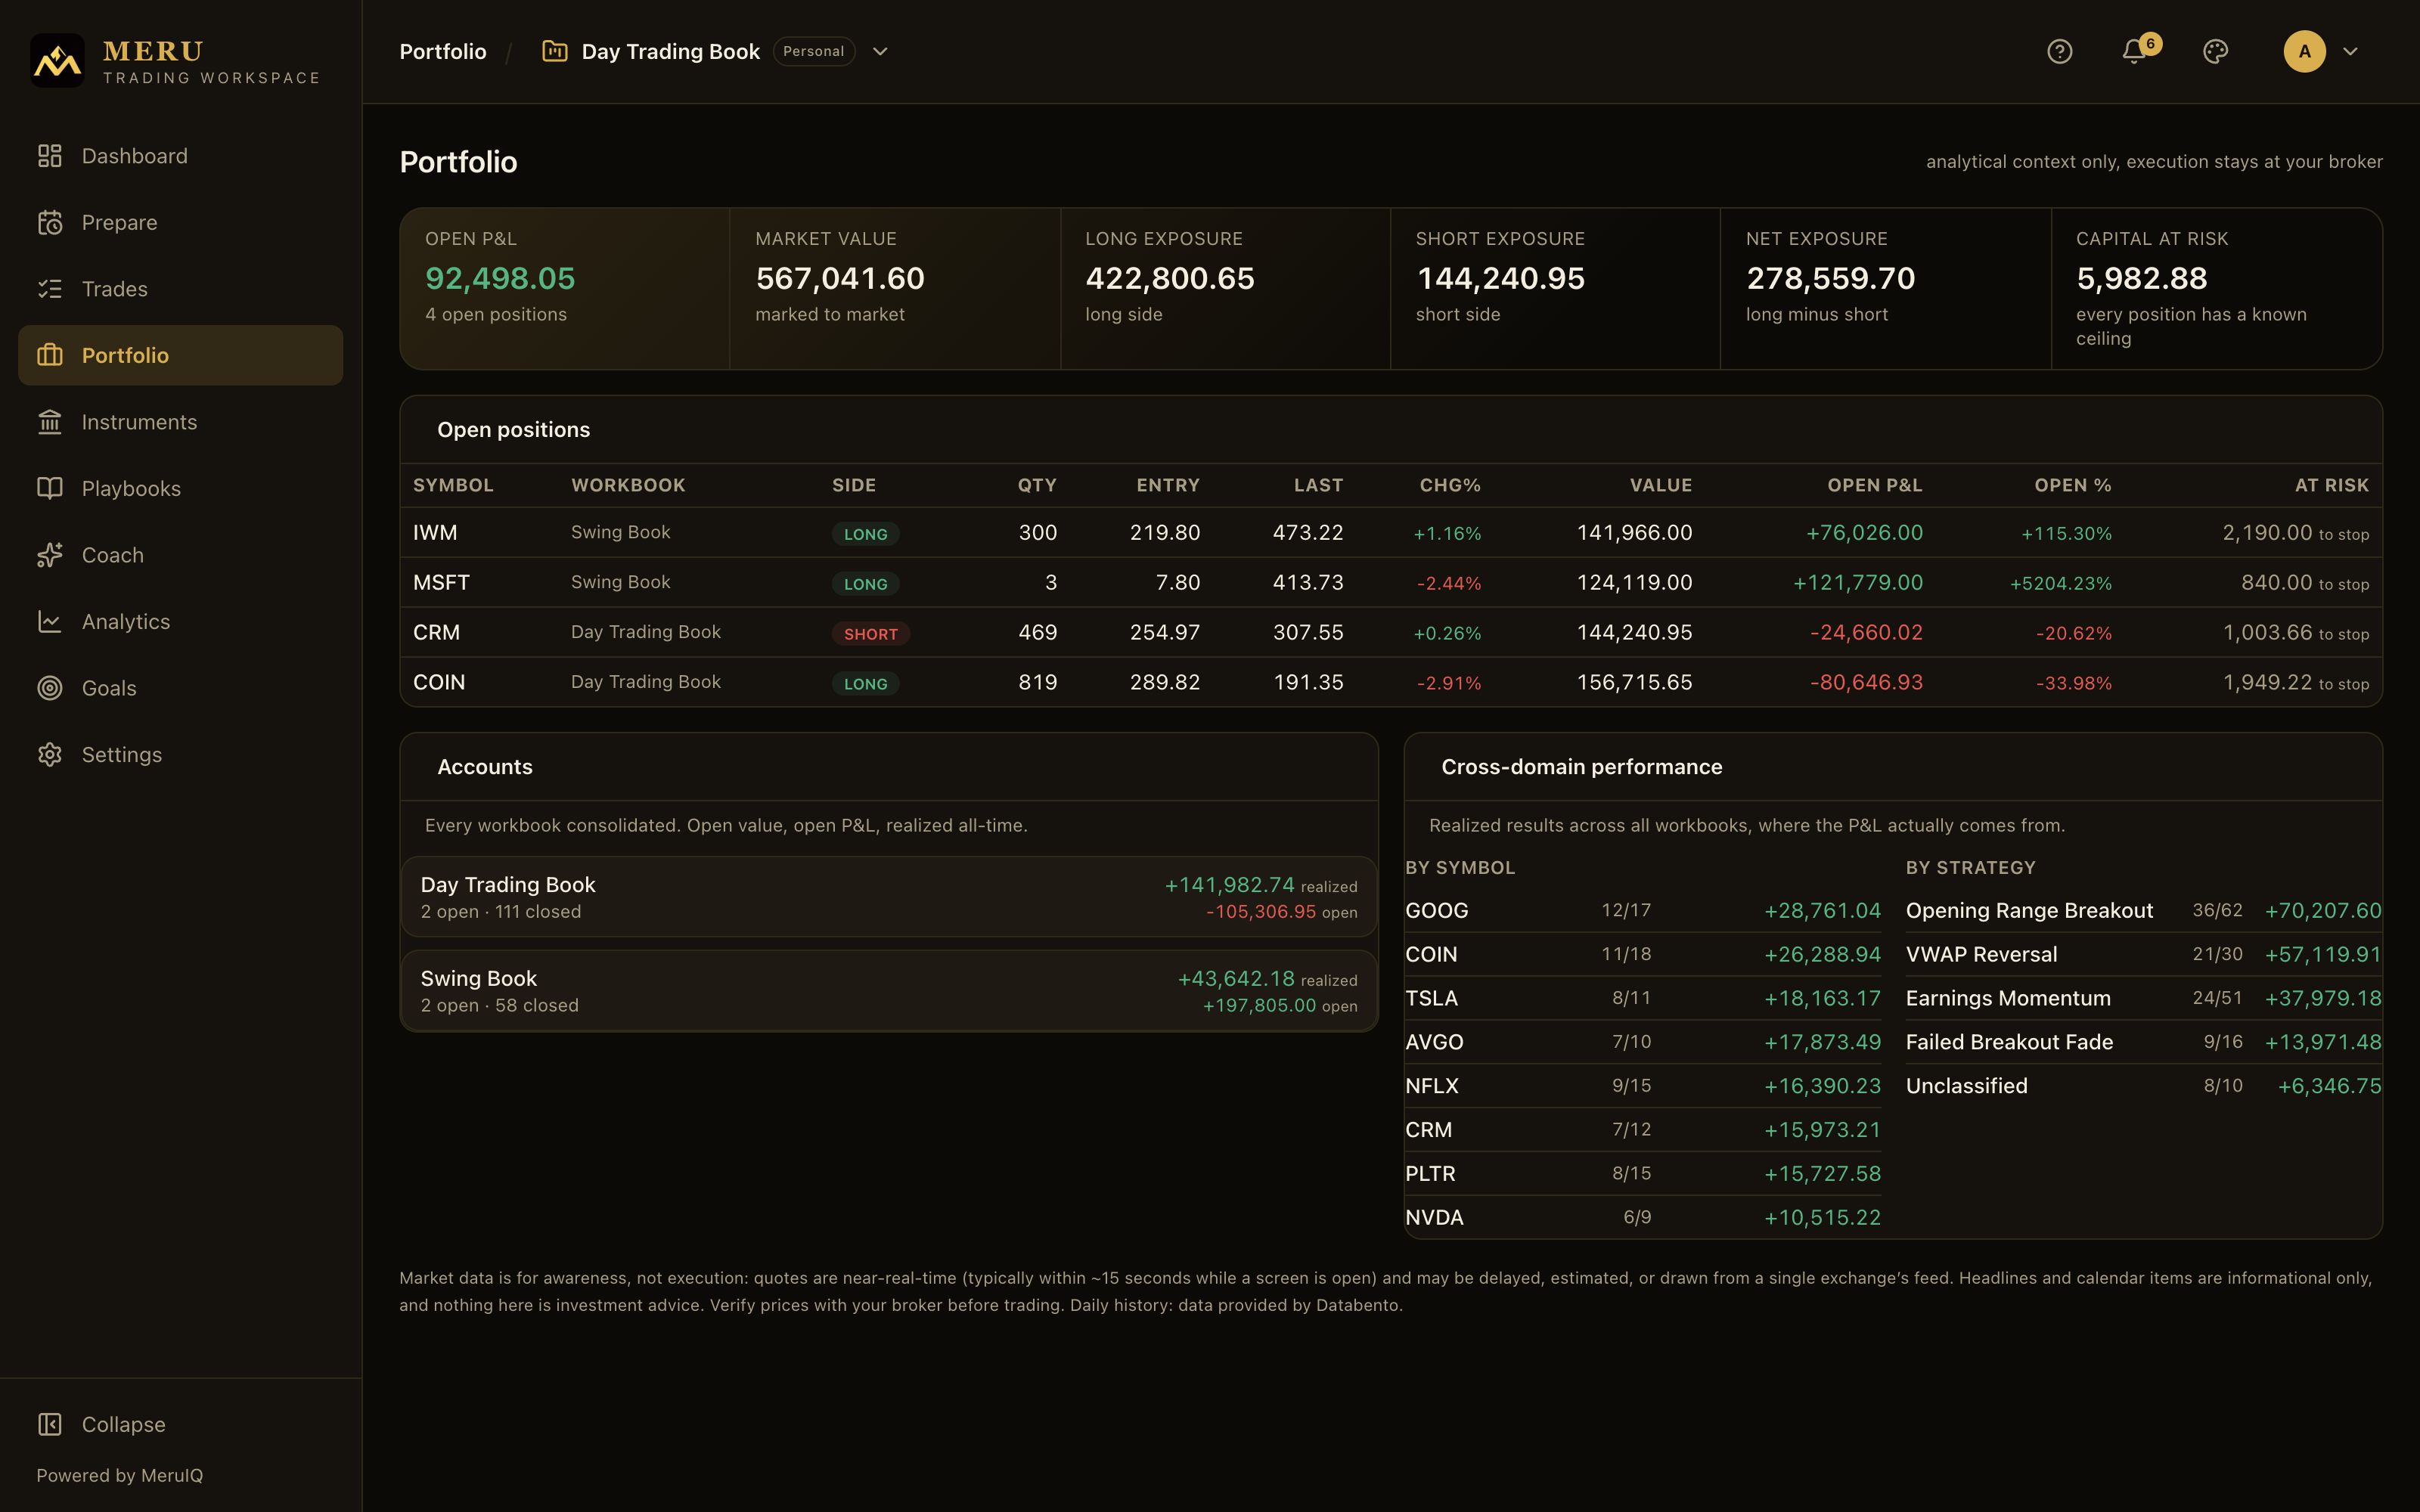
- Open P&L: the unrealized profit or loss across all open positions at the latest quotes, colored green when positive and red when negative. The caption counts your open positions and, where an instrument was bought on several days, the lots behind them.
- Market value: what all open positions are worth right now, marked to market at the last price.
- Long exposure: the market value deployed on the long side.
- Short exposure: the market value deployed on the short side.
- Net exposure: long minus short. Near zero means you are roughly market-neutral; a large positive or negative number means a directional bet.
- Capital at risk: what your open positions can lose. Each contributes the most it can actually cost: the distance to its stop where there is one; otherwise whatever caps it anyway (a long position can fall to zero, a long option can only lose its premium, a cash-secured put can only be assigned at its strike, a spread can only lose its debit or its width). Contract sizes are included, so two option contracts count as two hundred shares. Positions with no ceiling at all, like short stock, are named rather than counted, and the caption under the tile says either every position has a known ceiling or how many have none.
Open positions
The Open positions table lists what you hold in the active workbook (or across all of them, with the toggle on), one row per instrument. Where you bought the same instrument on several days, those lots are consolidated into one row at their cost-weighted average price (what you paid, over what you bought), with a lots count beside the symbol; click the row to unfold the individual trades. Each column:
- Symbol: the instrument. Click it to open the trade's detail page.
- Workbook: which workbook the position belongs to.
- Side: a LONG (green) or SHORT (red) badge.
- Qty: the open quantity.
- Entry: your entry price.
- Last: the latest quote. A position the data feed cannot price, such as an option contract or a forex pair on some feeds, shows a dash here and in the Chg%, Value and Open P&L columns rather than an invented number; it is carried at cost in exposure and contributes no open P&L.
- Chg%: the symbol's change on the day, colored by direction.
- Value: the position's current market value.
- Open P&L: unrealized profit or loss at the last price, signed and colored.
- Open %: the unrealized result as a percentage of your entry.
- At risk: this position's contribution to Capital at risk, with the grounds for the figure as a small label: to stop (entry to stop, times size), can go to zero (no stop, but the position can only fall to zero), premium (a long option can only lose what you paid), at the strike (a short put is assigned at the strike, less the premium collected), spread debit or spread width (a multi-leg structure's risk, counted once for the structure rather than per leg), or, in warning color, no ceiling, meaning nothing caps this loss and it is named rather than counted in the total. Hover a label for the explanation.
When nothing is open, the table is replaced by Flat, no open positions.
- Scan the At risk column for can go to zero and no ceiling labels.
- Click the position's Symbol to open the trade.
- Add the stop you are actually honoring at your broker. Capital at risk immediately tightens from the full entry value to the real stop distance, and the label changes to to stop.
Accounts
The Accounts card rolls every workbook into one row apiece: open and closed trade counts, all-time realized P&L, and current open P&L. Realized is the money already booked from closed trades; open is what the current positions are showing at the latest quotes. Before you have recorded anything, the card reads No trading history yet.
Cross-domain performance
The Cross-domain performance card breaks down realized results across all workbooks, so you can see where the P&L actually comes from. Two tables slice your closed trades:
- By symbol: each traded symbol with its wins over total closed trades and its realized P&L.
- By strategy: the same breakdown per playbook, so you can see which setups pay across every workbook combined.
Each table shows the top rows; until you close trades, it reads No closed trades yet.
How quotes refresh
Positions are marked to market automatically. The page refreshes itself every two minutes, and it also updates live whenever new quotes arrive on the streaming feed, so Last, Chg%, Value, and every P&L figure tick without a reload. Each refresh also tells the backend which symbols you hold, so the quote feed keeps following your current book. While the first load runs, you'll briefly see Marking positions to market…
A disclaimer at the foot of the page, repeated on every screen that shows quotes, states what the data is for: market data is for awareness, not execution; quotes are near-real-time (typically within about 15 seconds while a screen is open) and may be delayed, estimated, or drawn from a single exchange's feed; verify prices with your broker before trading. Where daily history comes from Databento, the line credits it.